Copyright
©The Author(s) 2020.
World J Gastroenterol. Dec 28, 2020; 26(48): 7693-7706
Published online Dec 28, 2020. doi: 10.3748/wjg.v26.i48.7693
Published online Dec 28, 2020. doi: 10.3748/wjg.v26.i48.7693
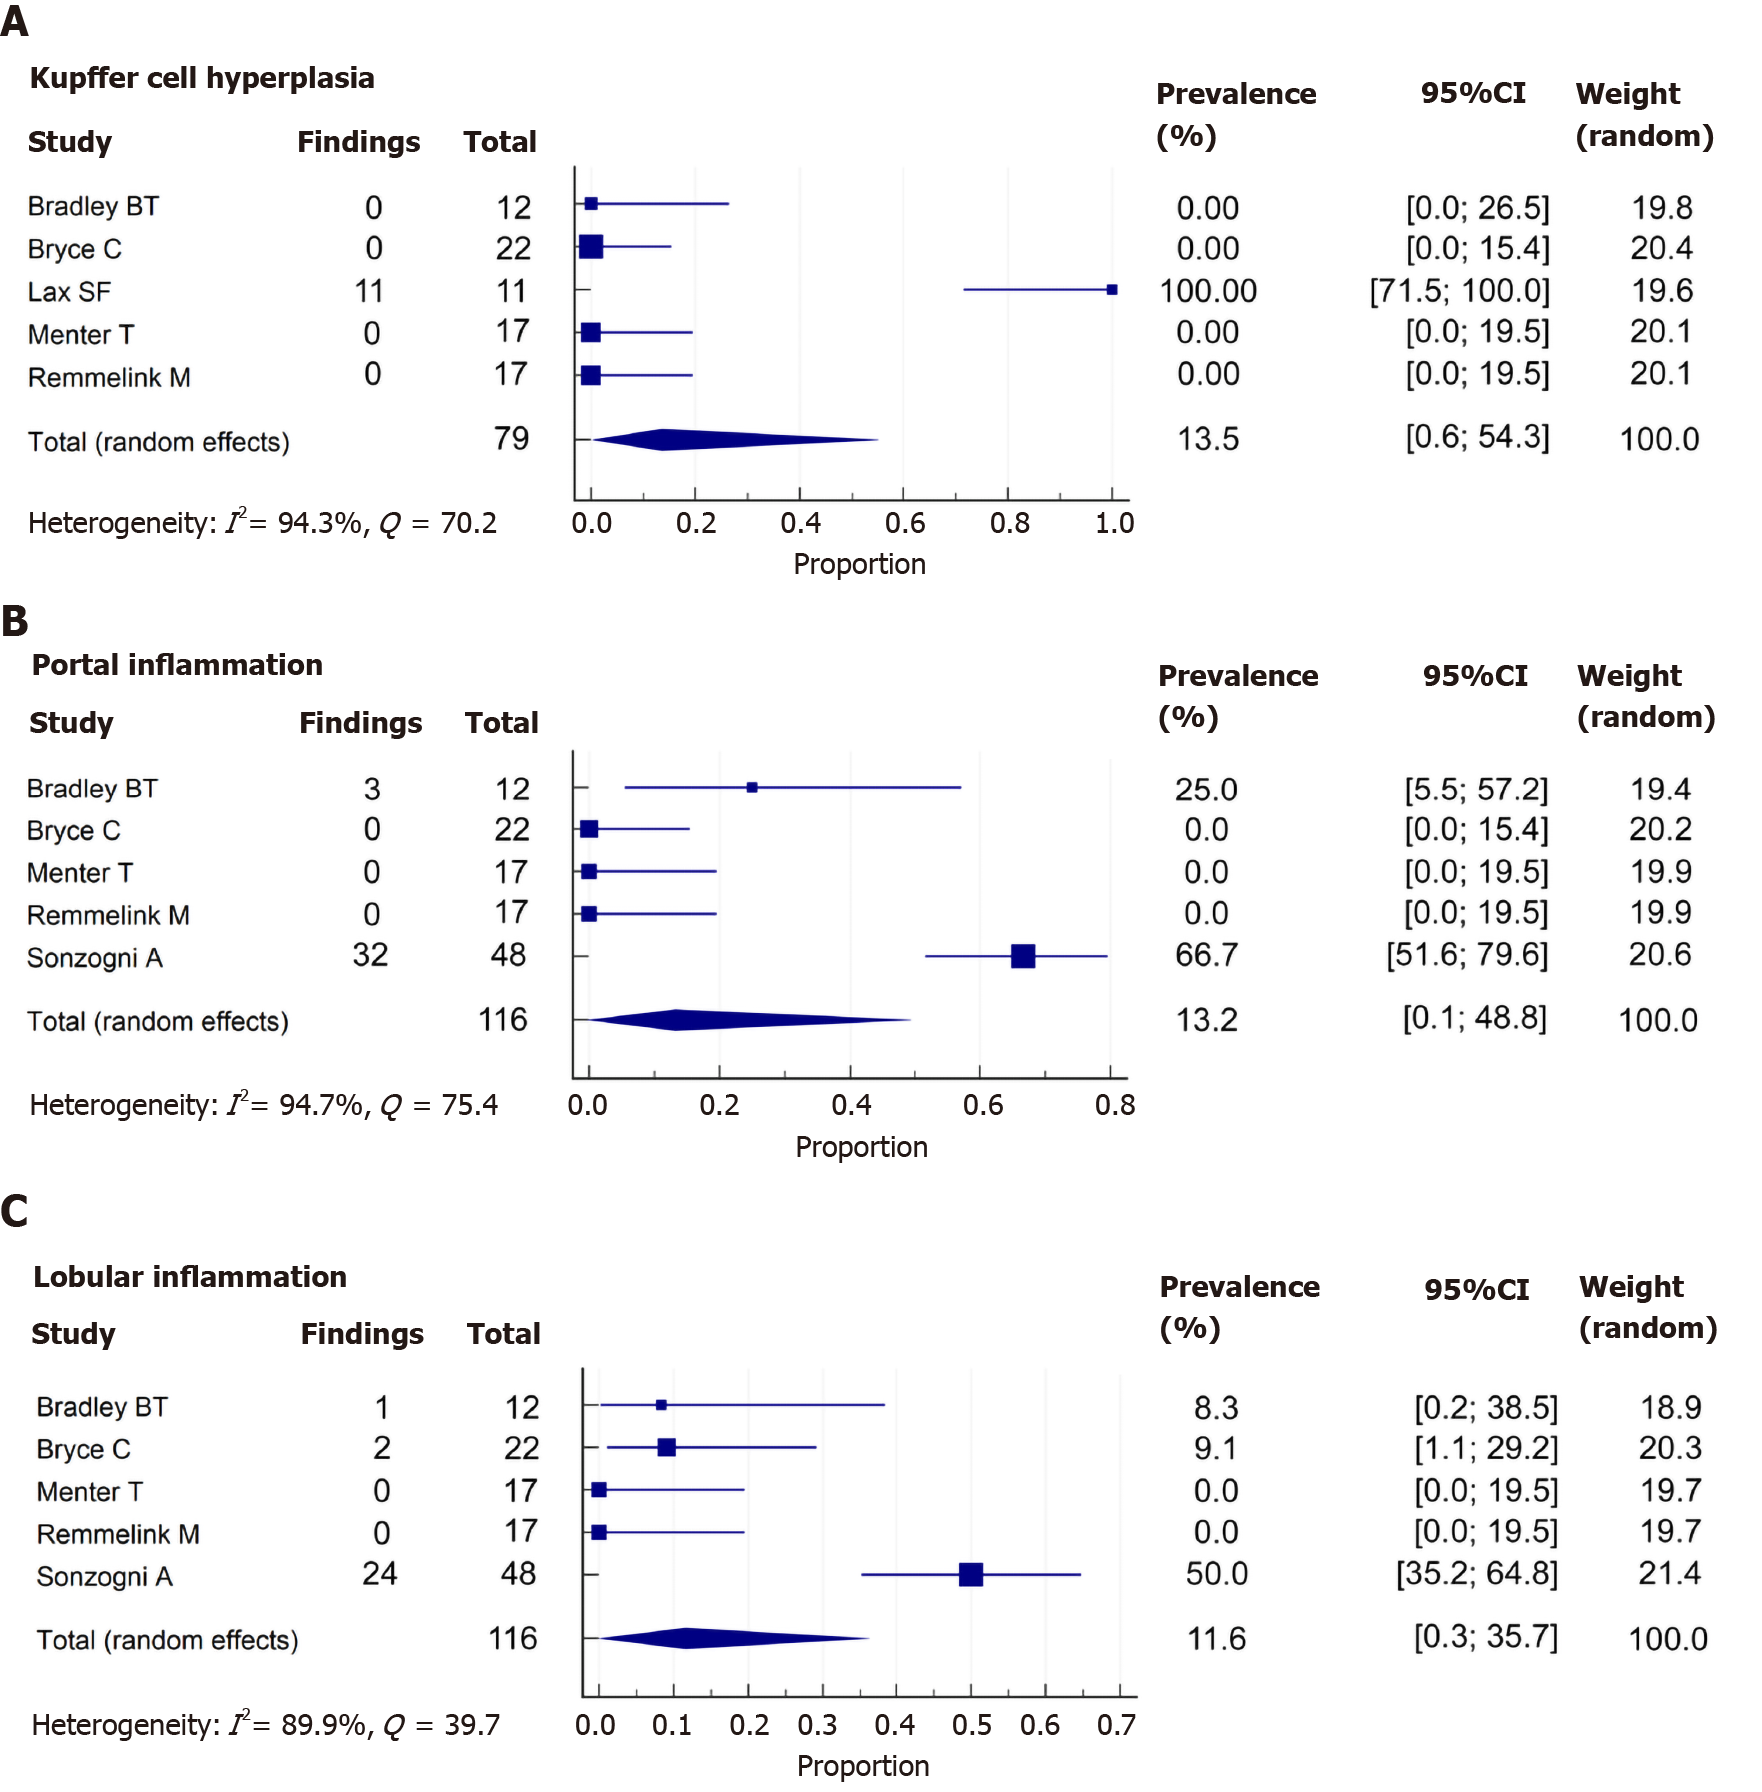
Figure 4 Forest plots of inflammatory liver histological features from deceased coronavirus disease 2019 patients.
A-C: The figure includes forest plots of Kupffer cell hyperplasia (A), portal inflammation (B), and lobular inflammation (C). Heterogeneity was assessed using I2 and Q statistics. CI: Confidence interval.
- Citation: Díaz LA, Idalsoaga F, Cannistra M, Candia R, Cabrera D, Barrera F, Soza A, Graham R, Riquelme A, Arrese M, Leise MD, Arab JP. High prevalence of hepatic steatosis and vascular thrombosis in COVID-19: A systematic review and meta-analysis of autopsy data. World J Gastroenterol 2020; 26(48): 7693-7706
- URL: https://www.wjgnet.com/1007-9327/full/v26/i48/7693.htm
- DOI: https://dx.doi.org/10.3748/wjg.v26.i48.7693


