Copyright
©The Author(s) 2020.
World J Gastroenterol. Dec 21, 2020; 26(47): 7584-7592
Published online Dec 21, 2020. doi: 10.3748/wjg.v26.i47.7584
Published online Dec 21, 2020. doi: 10.3748/wjg.v26.i47.7584
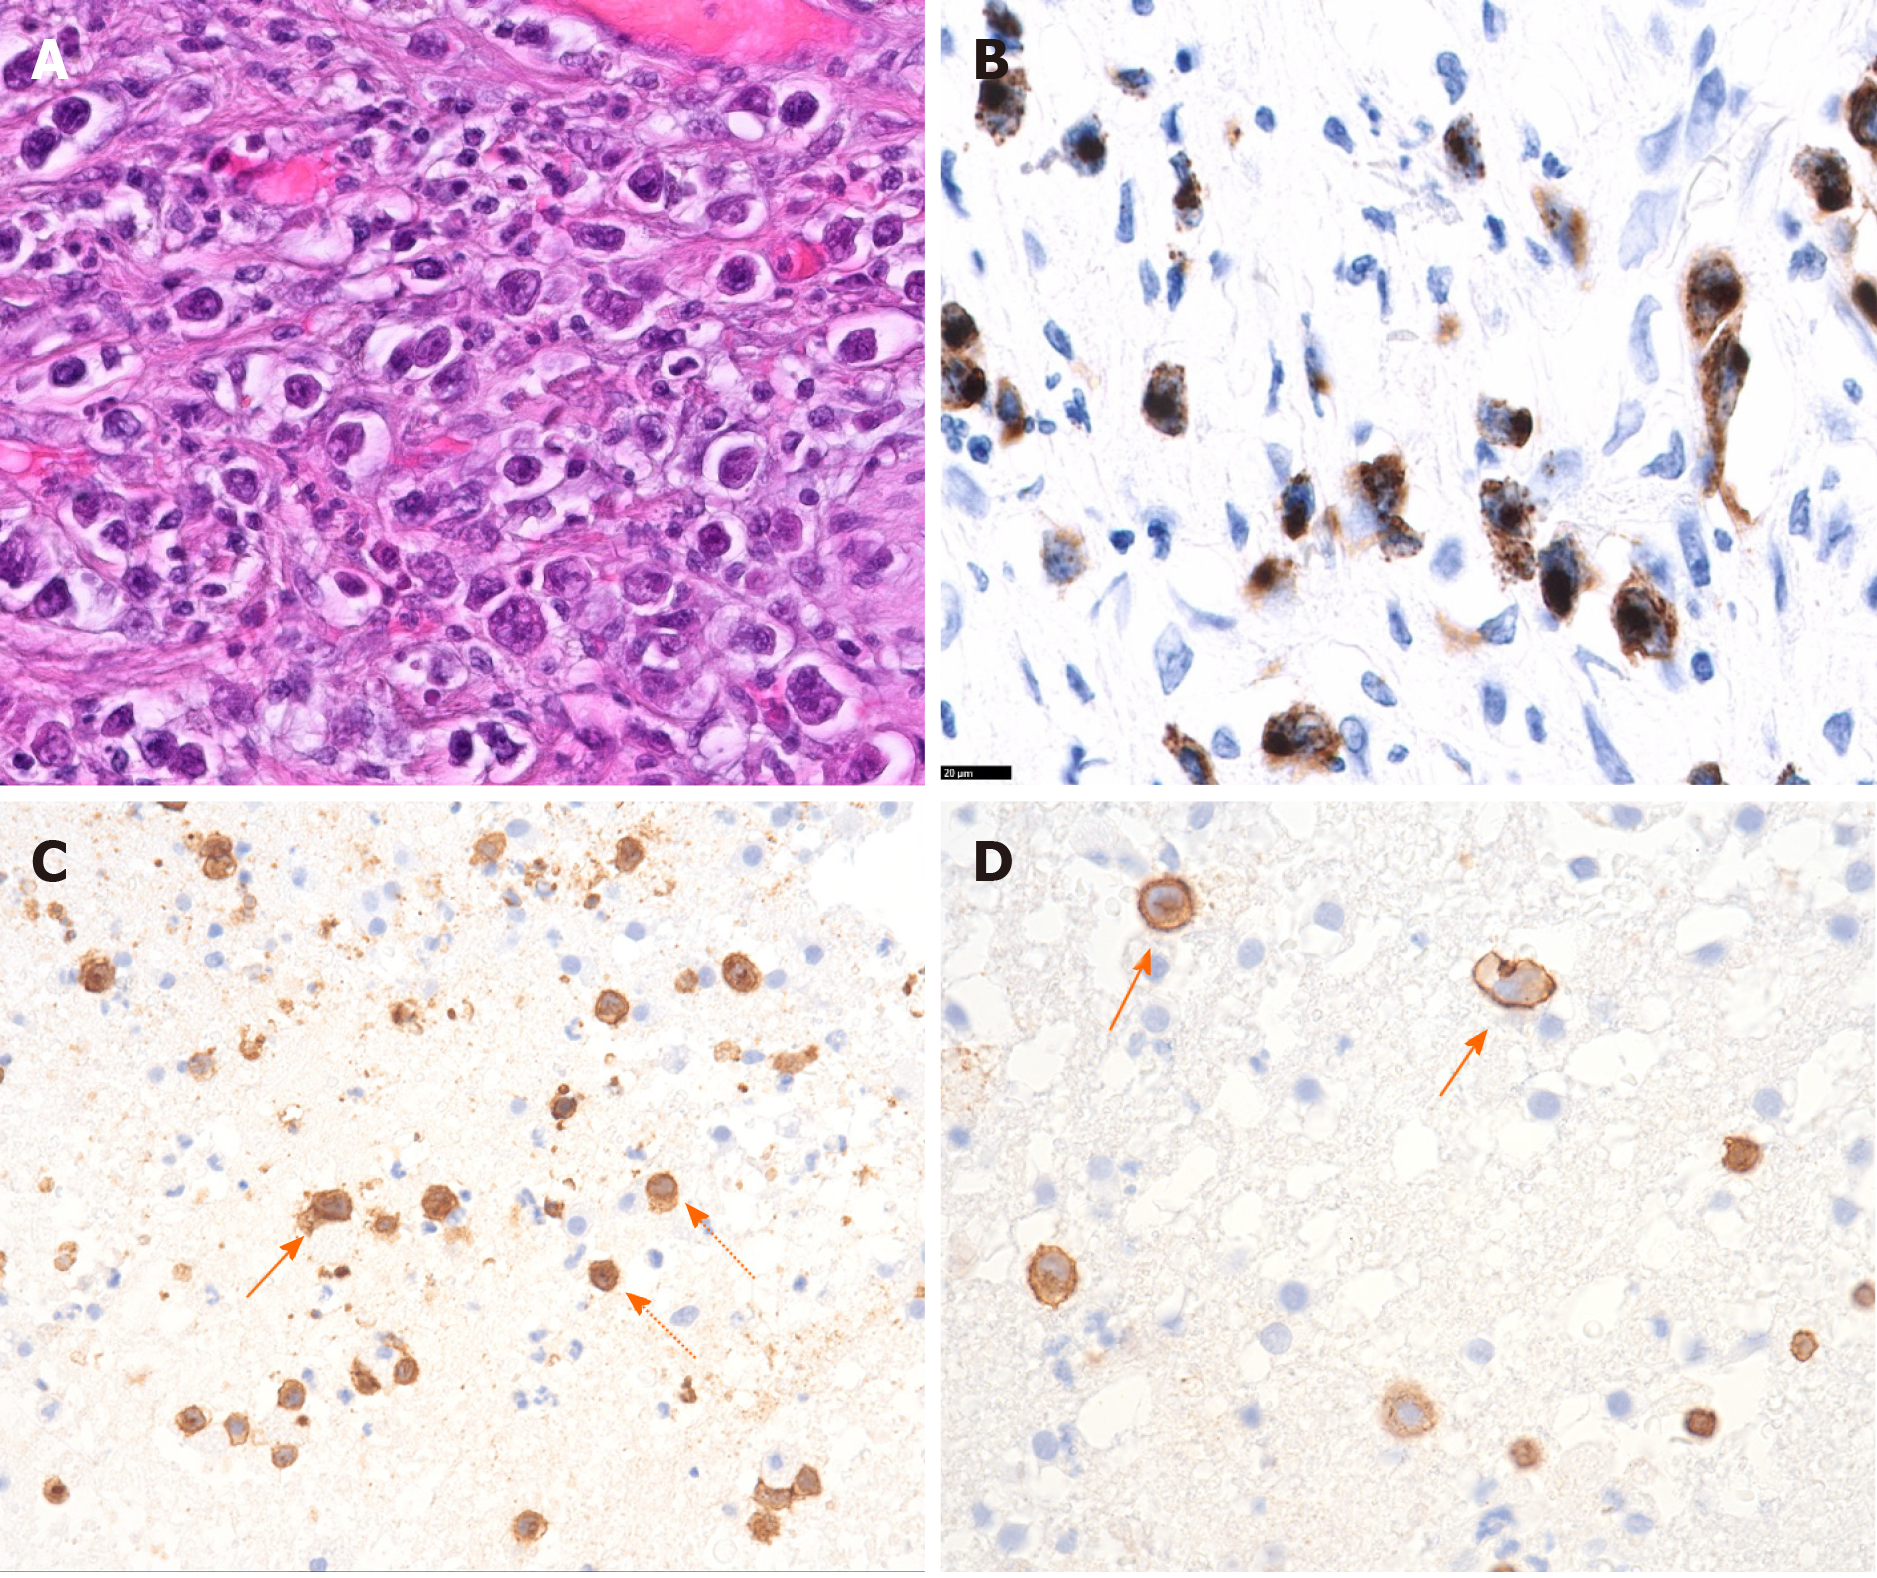
Figure 4 Histological presentation of enteropathy-associated T cell lymphoma.
A and B: Jejunal biopsy. Hematoxylin and eosin staining (A) showing large anaplastic tumor cells and immunohistochemical staining (B) showing granzyme B positive (brown) tumor cells; C and D: Cerebral biopsy. Infiltration of CD3 positive lymphoma cells (arrow) and non-malignant T lymphocytes (dotted arrow). Magnification 600 × (A, B and D) and 400 × (C).
- Citation: Horvath L, Oberhuber G, Chott A, Effenberger M, Tilg H, Gunsilius E, Wolf D, Iglseder S. Multiple cerebral lesions in a patient with refractory celiac disease: A case report. World J Gastroenterol 2020; 26(47): 7584-7592
- URL: https://www.wjgnet.com/1007-9327/full/v26/i47/7584.htm
- DOI: https://dx.doi.org/10.3748/wjg.v26.i47.7584


