Copyright
©The Author(s) 2020.
World J Gastroenterol. Nov 28, 2020; 26(44): 6929-6944
Published online Nov 28, 2020. doi: 10.3748/wjg.v26.i44.6929
Published online Nov 28, 2020. doi: 10.3748/wjg.v26.i44.6929
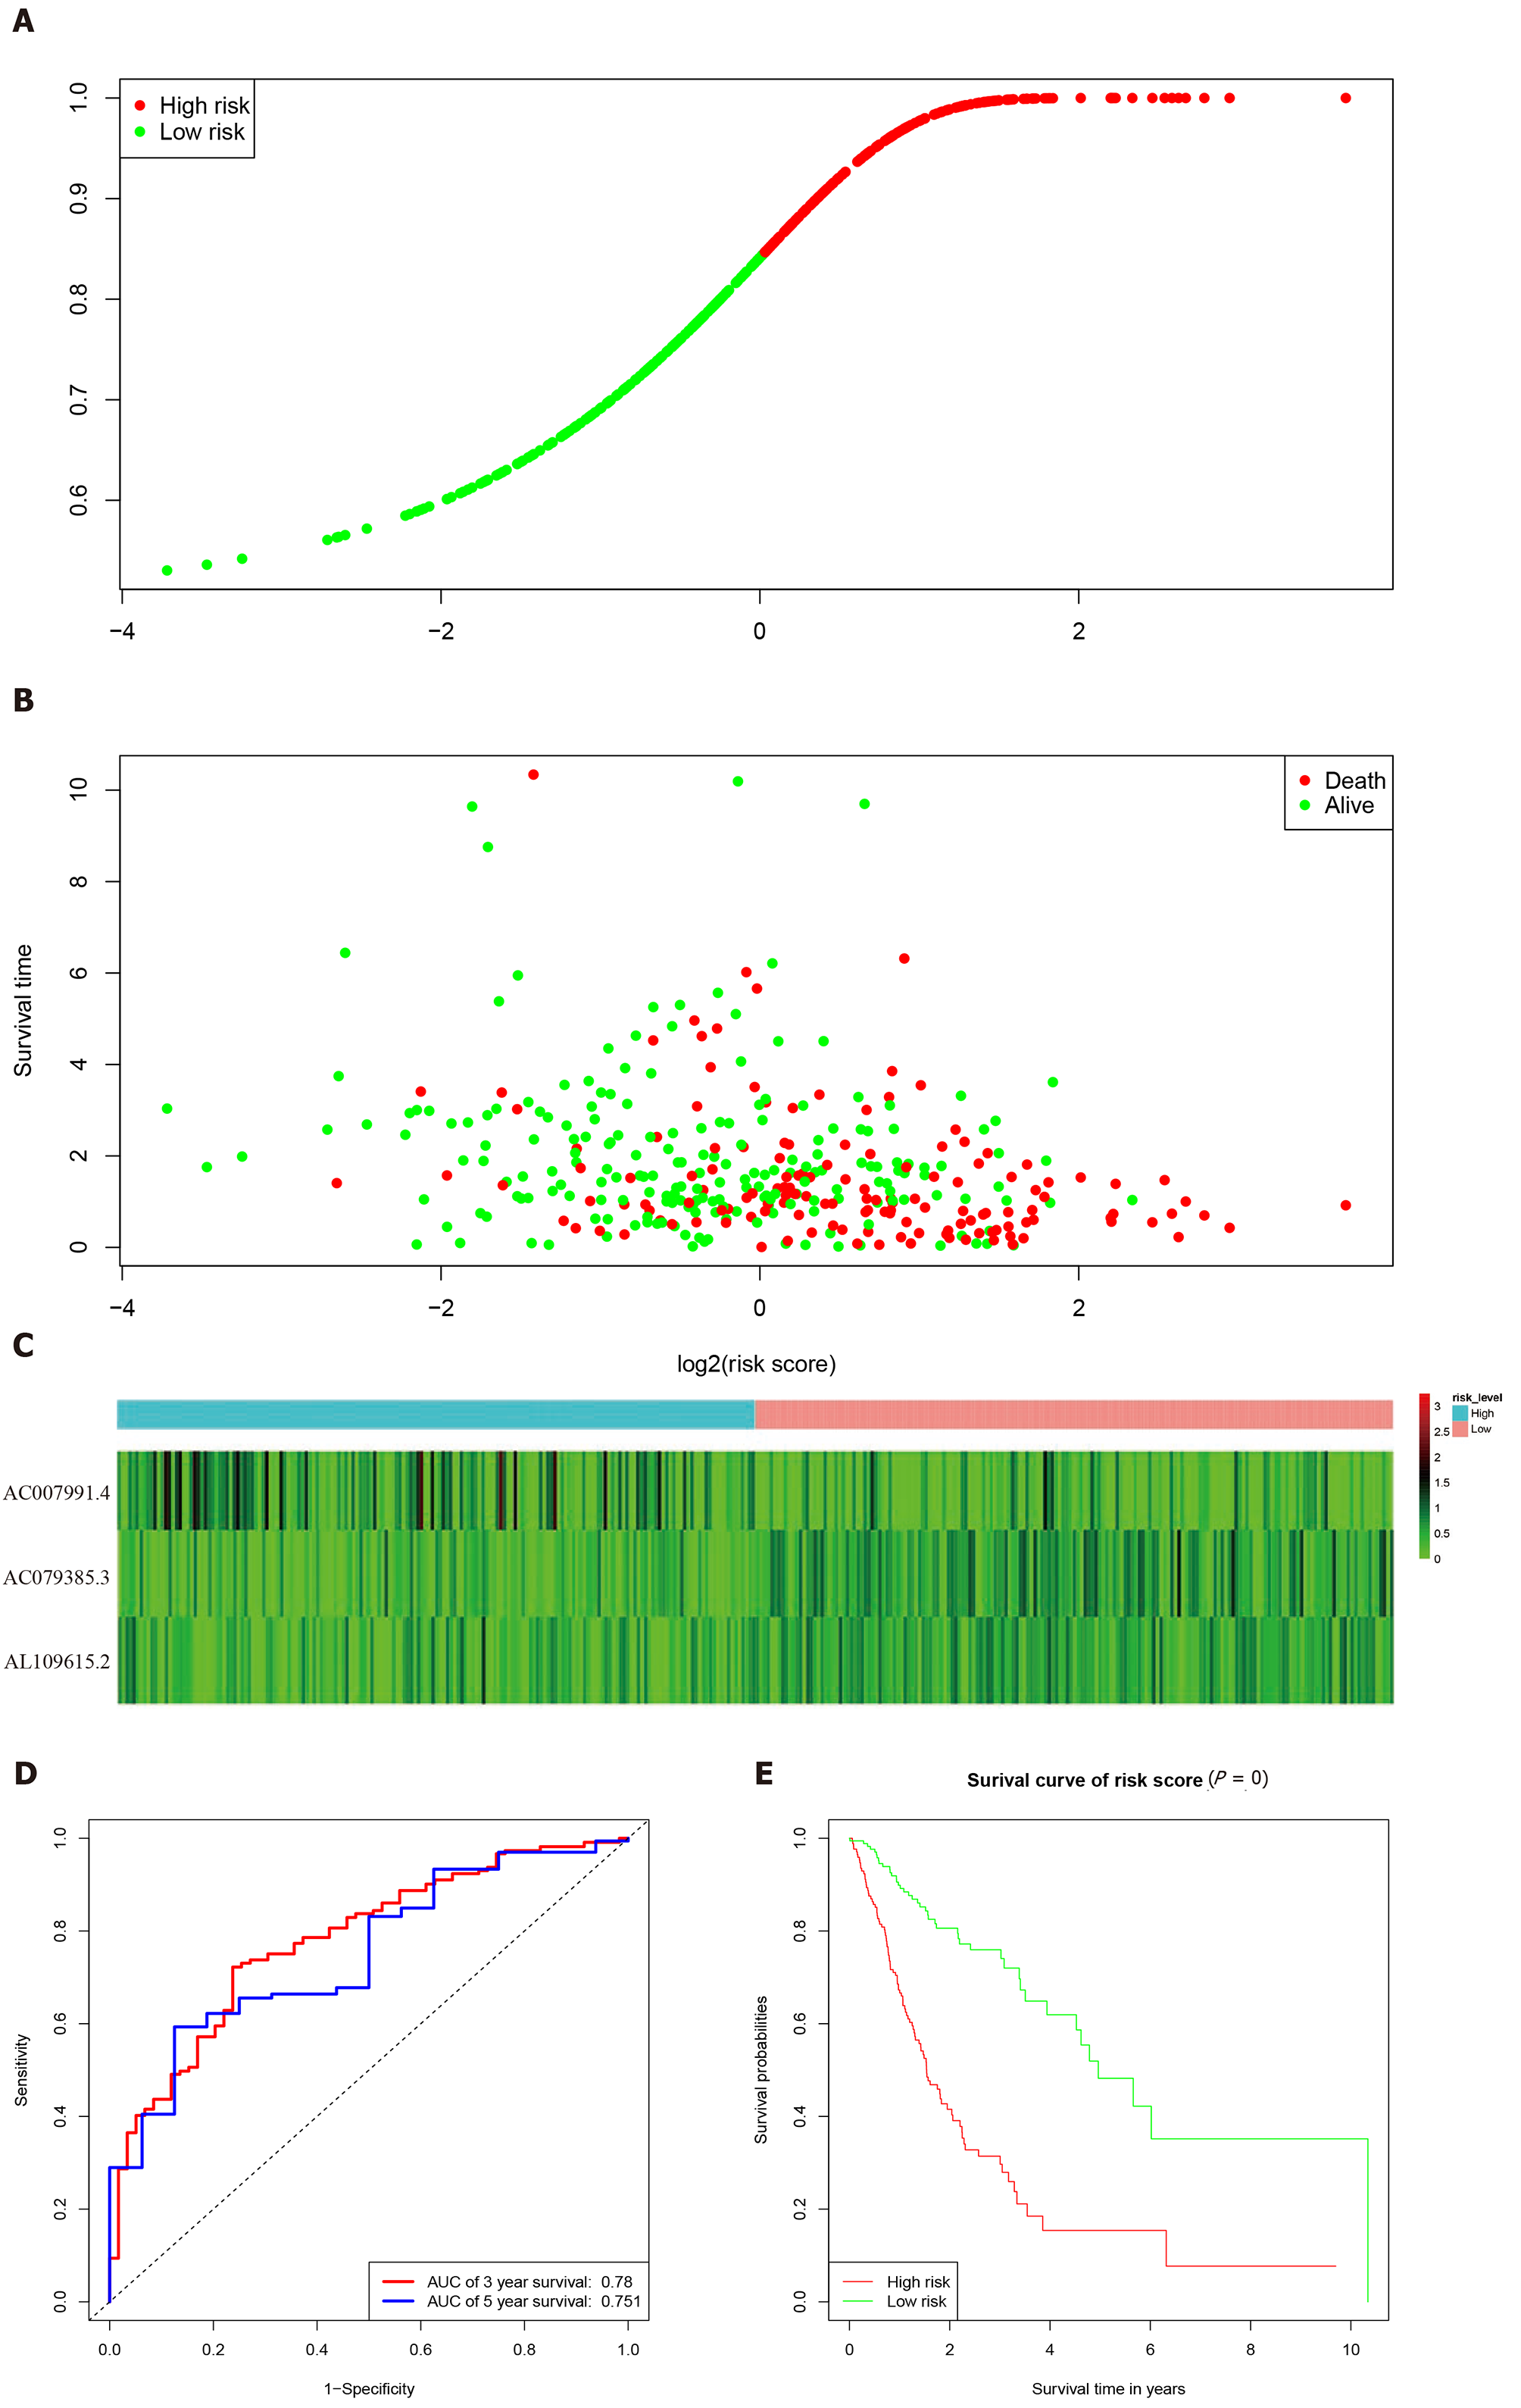
Figure 3 Characteristics of the 3-long noncoding RNA combination in The Cancer Genome Atlas queue.
A: The Cancer Genome Atlas samples arranged according to risk score (the low-risk group, green, the high-risk group, red); B: The Cancer Genome Atlas samples arranged according to survival time in years (red, death; green, alive); C: Heatmap showing the expression of three long noncoding RNAs in samples according to the risk score (blue, low-risk group; pink, high-risk group); D: The receiver operating characteristic curve for evaluating the predictive effectiveness of the model; E: The high-risk group in this model has a worse overall survival. AUC: Area under the curve.
- Citation: Zhang J, Piao HY, Wang Y, Lou MY, Guo S, Zhao Y. Development and validation of a three-long noncoding RNA signature for predicting prognosis of patients with gastric cancer. World J Gastroenterol 2020; 26(44): 6929-6944
- URL: https://www.wjgnet.com/1007-9327/full/v26/i44/6929.htm
- DOI: https://dx.doi.org/10.3748/wjg.v26.i44.6929


