Copyright
©The Author(s) 2020.
World J Gastroenterol. Nov 14, 2020; 26(42): 6638-6657
Published online Nov 14, 2020. doi: 10.3748/wjg.v26.i42.6638
Published online Nov 14, 2020. doi: 10.3748/wjg.v26.i42.6638
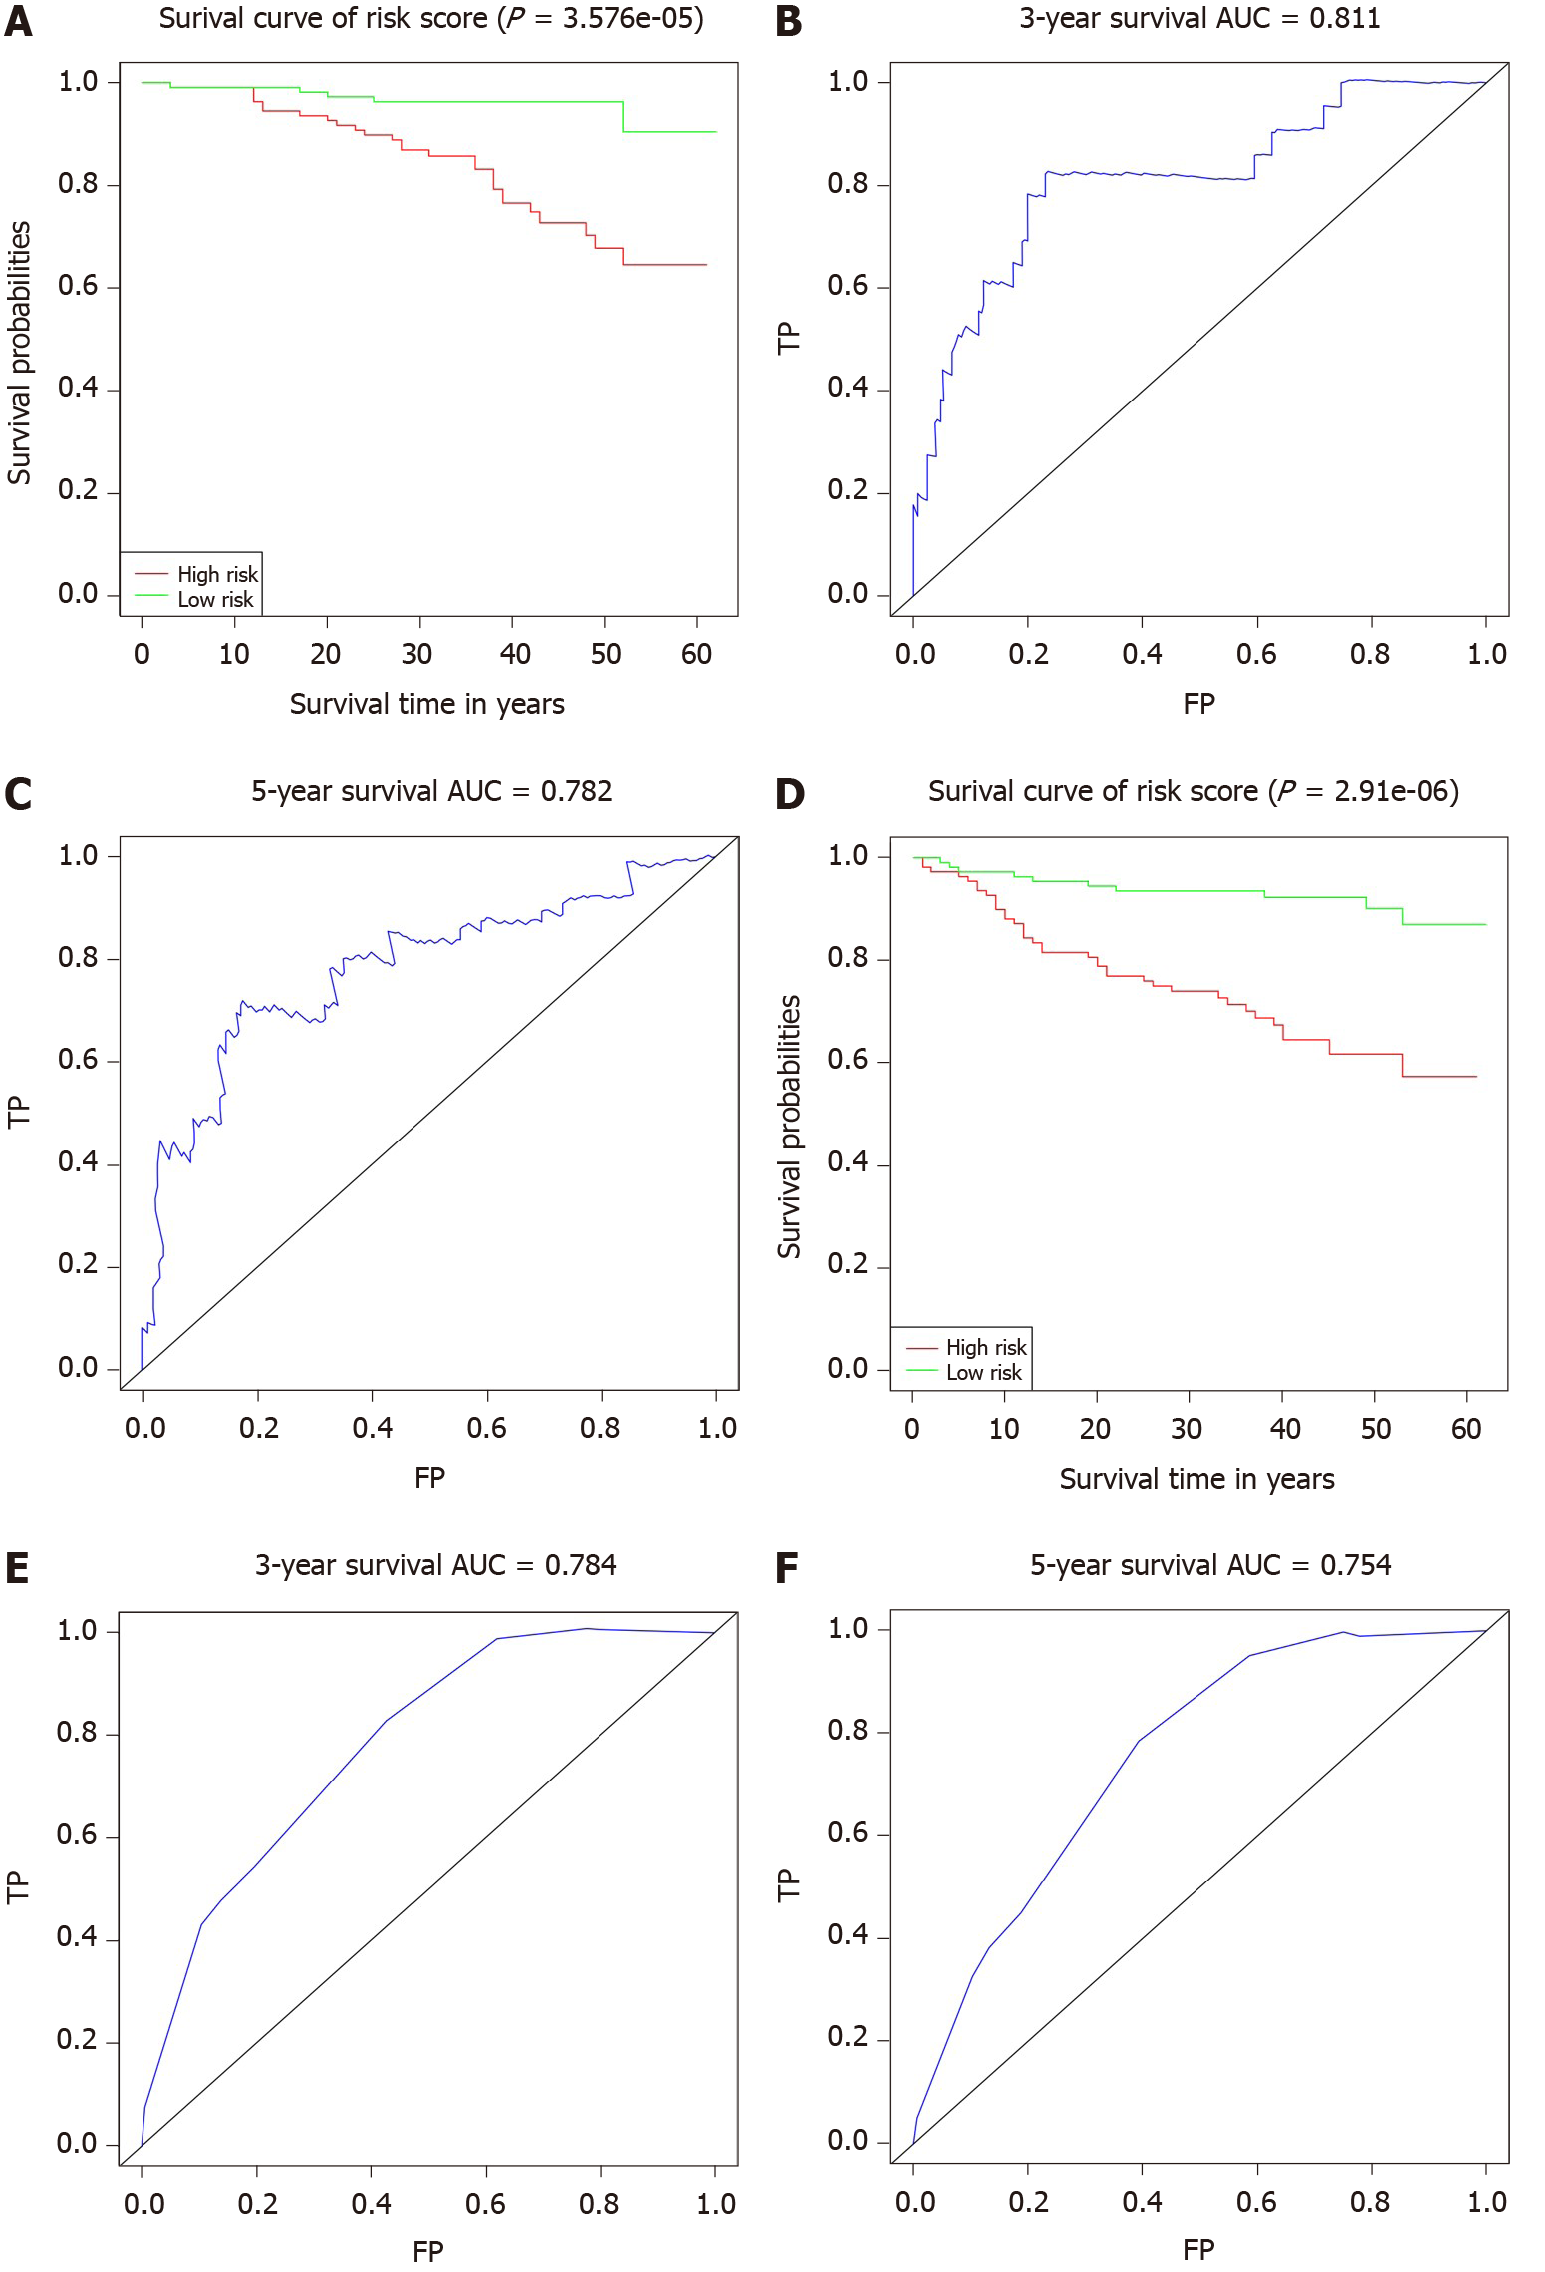
Figure 7 Kaplan-Meier and receiver operating characteristic curve for the risk factor score prediction model.
A: Kaplan-Meier (K-M) overall survival (OS) curves for the low-risk and high-risk groups; B: Receiver operating characteristic (ROC) curves for the 3-year and C: 5-year OS rates of locally advanced rectal cancer (LARC); D: K-M disease-free survival (DFS) curves for the low-risk and high-risk groups; E: ROC curves for the 3-year and F: 5-year DFS rates of LARC.
- Citation: Wei FZ, Mei SW, Chen JN, Wang ZJ, Shen HY, Li J, Zhao FQ, Liu Z, Liu Q. Nomograms and risk score models for predicting survival in rectal cancer patients with neoadjuvant therapy. World J Gastroenterol 2020; 26(42): 6638-6657
- URL: https://www.wjgnet.com/1007-9327/full/v26/i42/6638.htm
- DOI: https://dx.doi.org/10.3748/wjg.v26.i42.6638


