Copyright
©The Author(s) 2020.
World J Gastroenterol. Nov 7, 2020; 26(41): 6414-6430
Published online Nov 7, 2020. doi: 10.3748/wjg.v26.i41.6414
Published online Nov 7, 2020. doi: 10.3748/wjg.v26.i41.6414
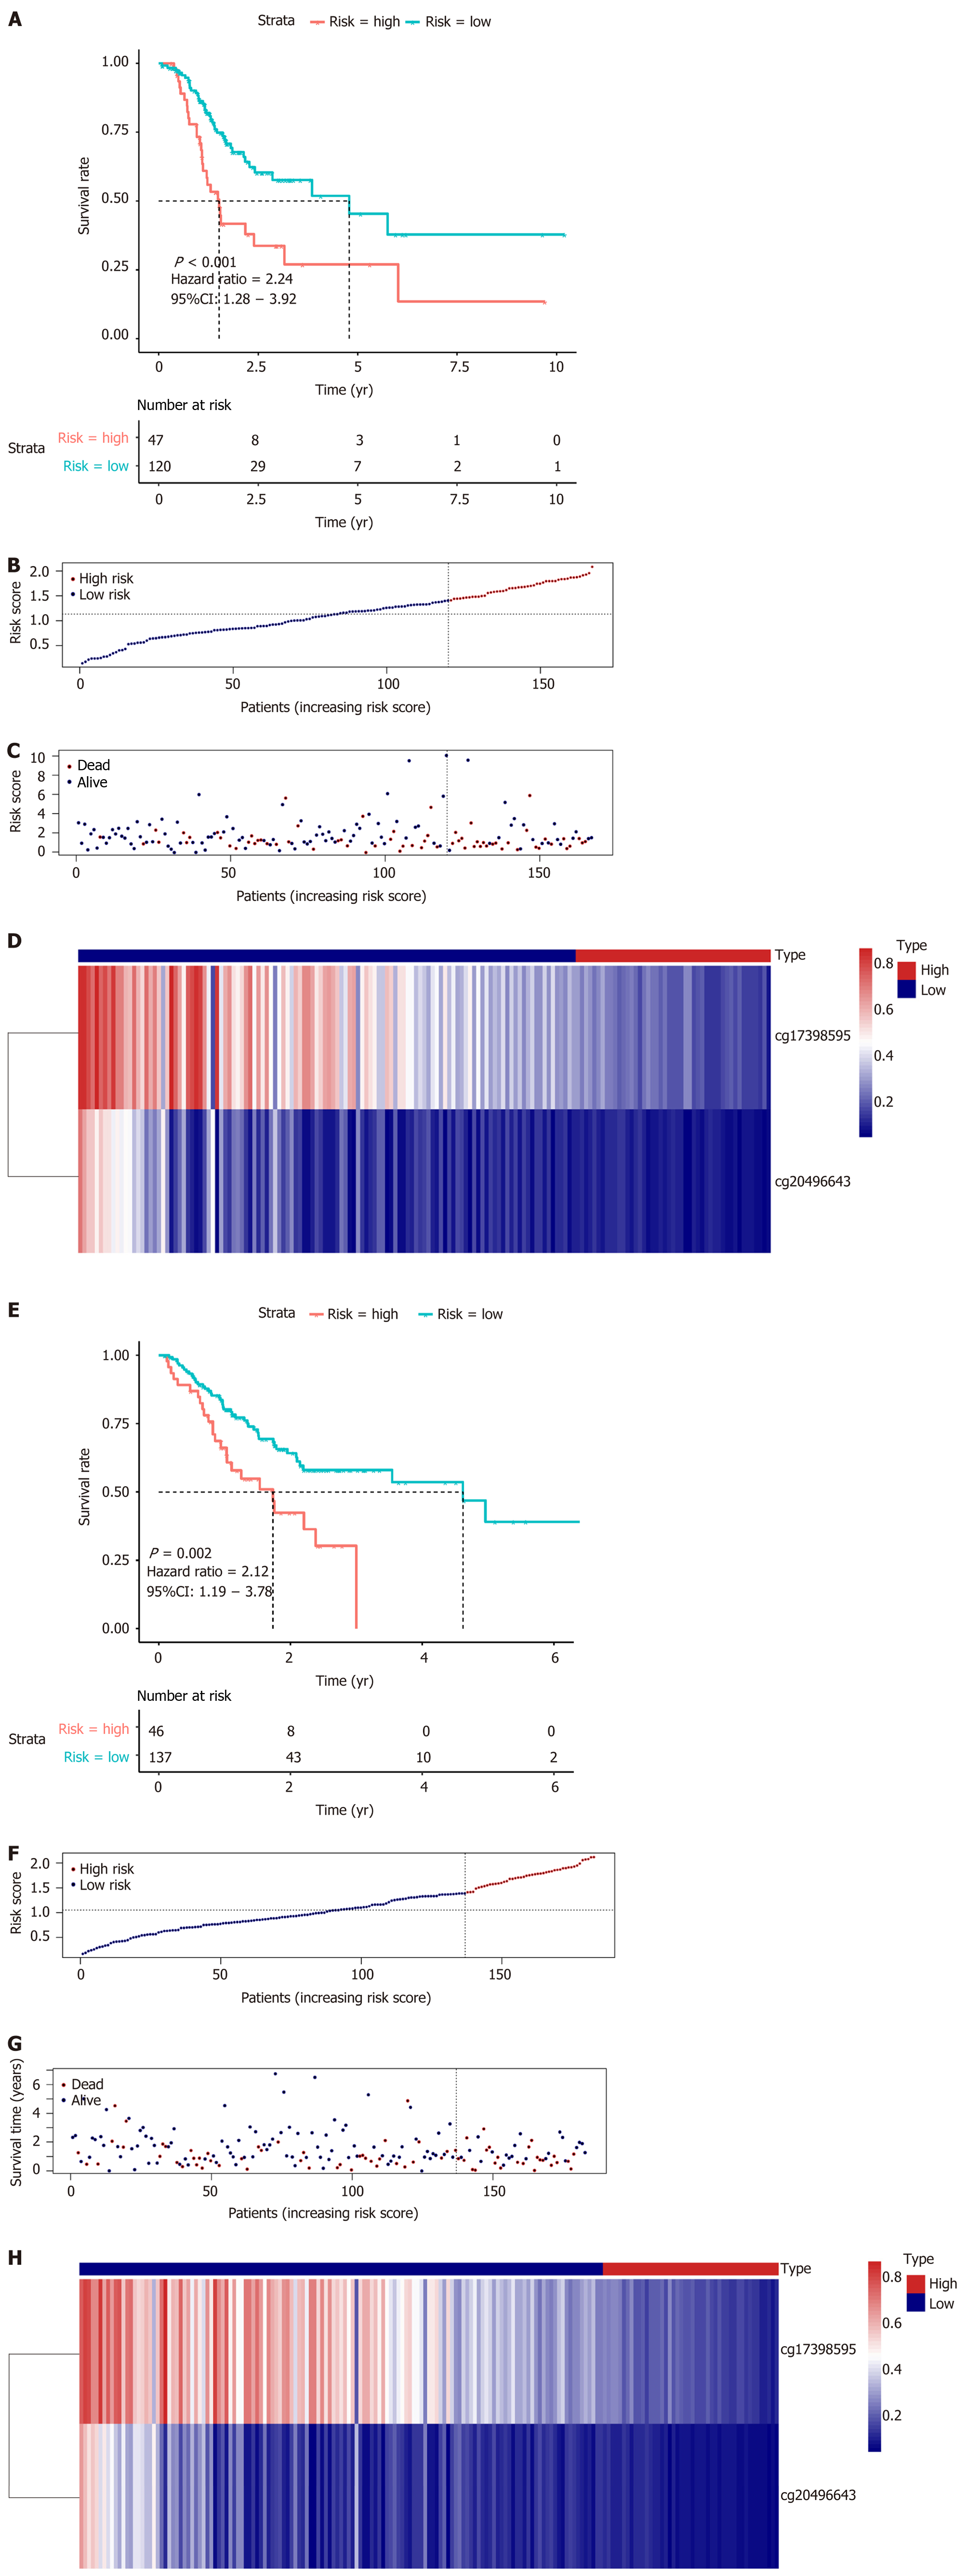
Figure 7 Survival analysis and risk score distribution of the prognostic model for the training and test sets.
A and E: K-M curves of the prognostic model in the training set and test set, respectively; B-D: The risk score distribution and heatmap of the methylation site profiles in the training set; F-H: The risk score distribution and heatmap of the methylation site profiles in the test set.
- Citation: Bian J, Long JY, Yang X, Yang XB, Xu YY, Lu X, Sang XT, Zhao HT. Signature based on molecular subtypes of deoxyribonucleic acid methylation predicts overall survival in gastric cancer. World J Gastroenterol 2020; 26(41): 6414-6430
- URL: https://www.wjgnet.com/1007-9327/full/v26/i41/6414.htm
- DOI: https://dx.doi.org/10.3748/wjg.v26.i41.6414


