Copyright
©The Author(s) 2020.
World J Gastroenterol. Nov 7, 2020; 26(41): 6414-6430
Published online Nov 7, 2020. doi: 10.3748/wjg.v26.i41.6414
Published online Nov 7, 2020. doi: 10.3748/wjg.v26.i41.6414
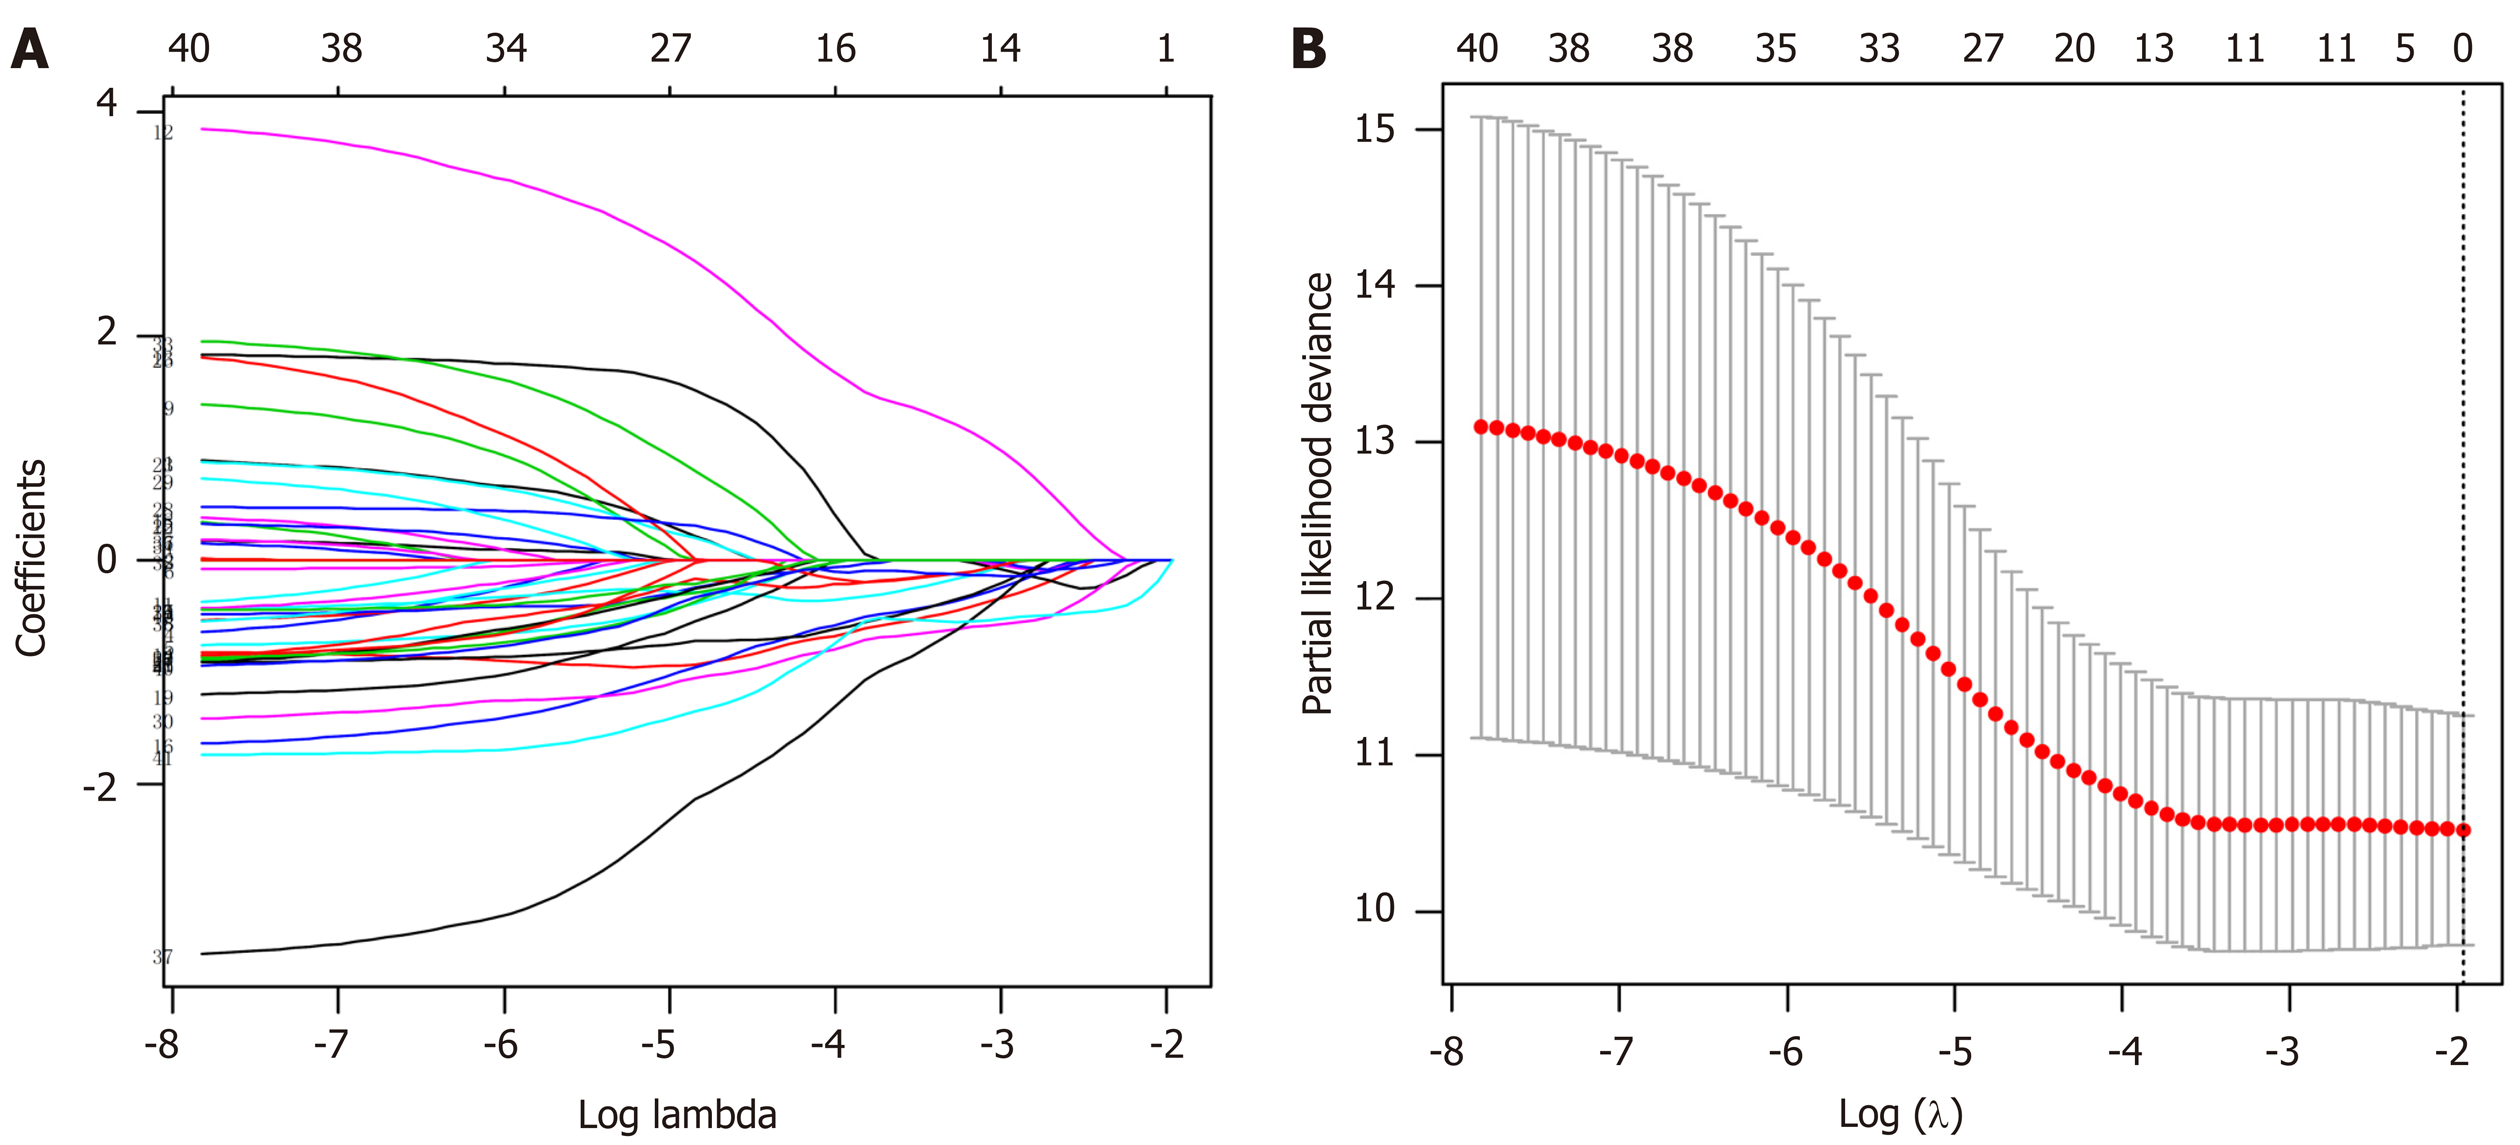
Figure 6 Selection of the prognostic methylation sites for gastric cancer patients by least absolute shrinkage and selection operator analysis.
A: The changing trajectory of each independent variable. The horizontal axis represents the log value of the independent variable lambda and the vertical axis represents the coefficient of the independent variable; B: Confidence intervals for each lambda. The optimal values of the penalty parameter lambda were determined by ten-fold cross-validation.
- Citation: Bian J, Long JY, Yang X, Yang XB, Xu YY, Lu X, Sang XT, Zhao HT. Signature based on molecular subtypes of deoxyribonucleic acid methylation predicts overall survival in gastric cancer. World J Gastroenterol 2020; 26(41): 6414-6430
- URL: https://www.wjgnet.com/1007-9327/full/v26/i41/6414.htm
- DOI: https://dx.doi.org/10.3748/wjg.v26.i41.6414


