Copyright
©The Author(s) 2020.
World J Gastroenterol. Nov 7, 2020; 26(41): 6414-6430
Published online Nov 7, 2020. doi: 10.3748/wjg.v26.i41.6414
Published online Nov 7, 2020. doi: 10.3748/wjg.v26.i41.6414
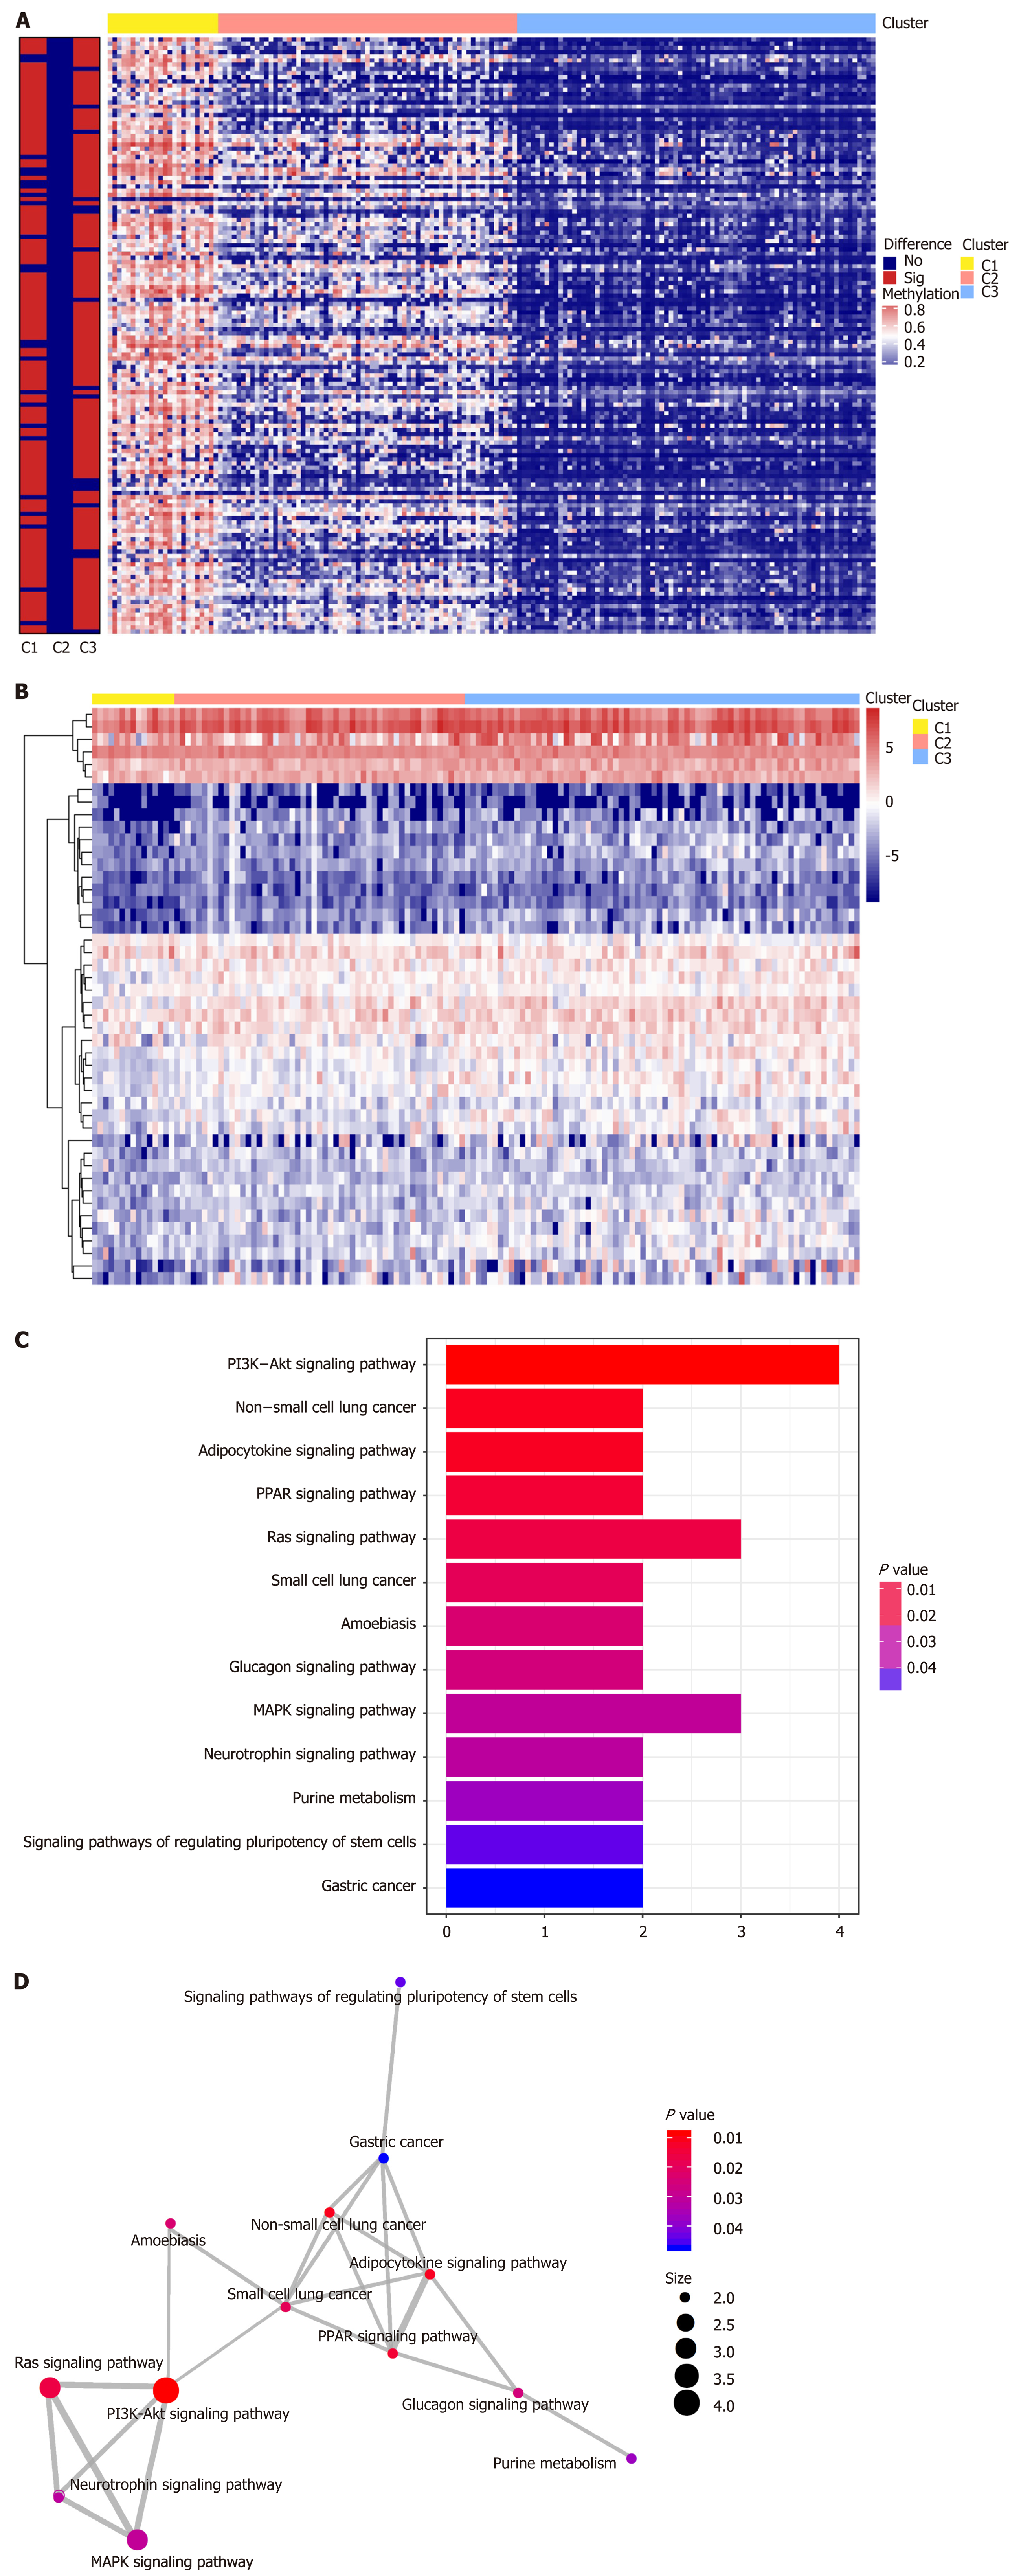
Figure 5 Differential analysis of CpG sites for each deoxyribonucleic acid methylation subtype.
A: The red and blue bars represent hypermethylated CpG sites and hypomethylated CpG sites, respectively (FDR < 0.05 and |log2 (fold change [FC])| > 1). The vertical bar to the left of the heatmap indicates the significance of methylation sites in each cluster, with the red and blue bars representing significance and insignificance, respectively; B: Heatmap for the annotated genes of specific sites among three Deoxyribonucleic acid methylation clusters; C: Kyoto encyclopedia of genes and genomes pathway enrichment analysis of the specific methylation sites; D: Crosstalk analysis of the enriched Kyoto encyclopedia of genes and genomes pathways shown in the enrichment map.
- Citation: Bian J, Long JY, Yang X, Yang XB, Xu YY, Lu X, Sang XT, Zhao HT. Signature based on molecular subtypes of deoxyribonucleic acid methylation predicts overall survival in gastric cancer. World J Gastroenterol 2020; 26(41): 6414-6430
- URL: https://www.wjgnet.com/1007-9327/full/v26/i41/6414.htm
- DOI: https://dx.doi.org/10.3748/wjg.v26.i41.6414


