Copyright
©The Author(s) 2020.
World J Gastroenterol. Nov 7, 2020; 26(41): 6414-6430
Published online Nov 7, 2020. doi: 10.3748/wjg.v26.i41.6414
Published online Nov 7, 2020. doi: 10.3748/wjg.v26.i41.6414
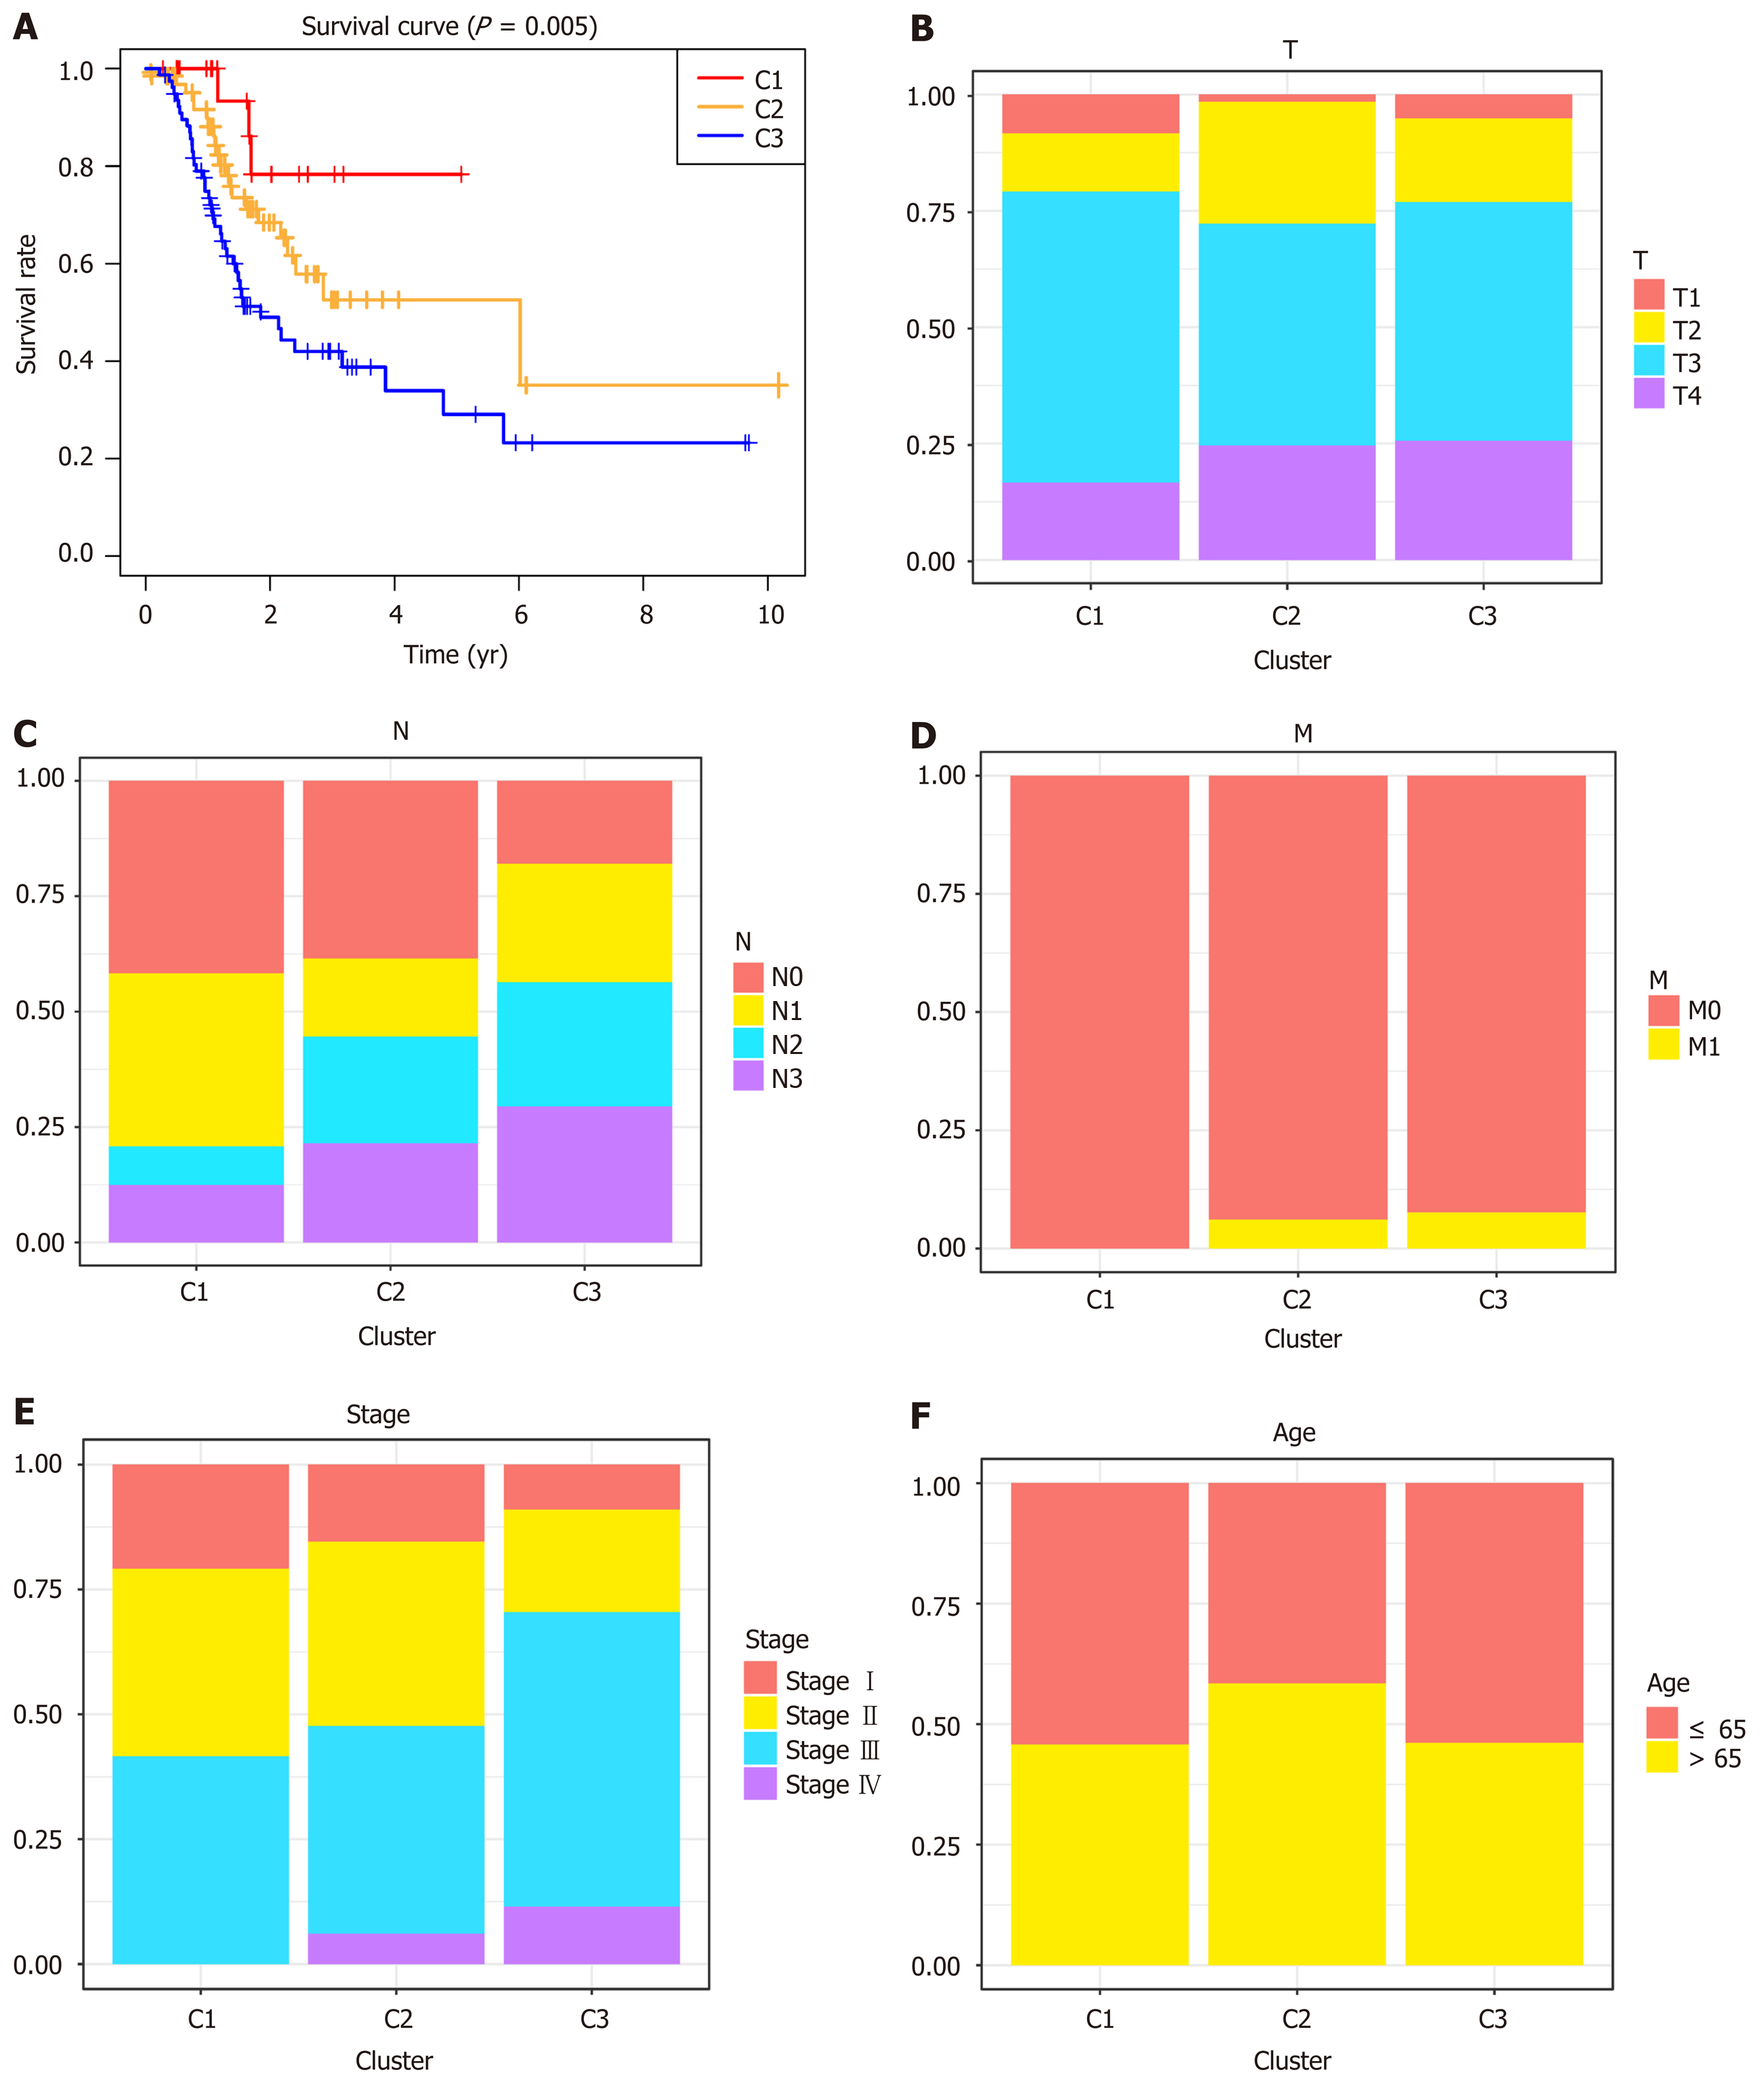
Figure 3 Survival curves of deoxyribonucleic acid methylation subtypes and comparison of TNM stage, grade, and age between clusters.
A: Survival curves of deoxyribonucleic acid (DNA) methylation subtypes in the training set; B: The size and extent of the main tumor; C: Lymph nodes invasion; D: Metastasis; E: TNM stage score; F: Age distributions for each DNA methylation subtype in the training set. The horizontal axis indicates the DNA methylation clusters.
- Citation: Bian J, Long JY, Yang X, Yang XB, Xu YY, Lu X, Sang XT, Zhao HT. Signature based on molecular subtypes of deoxyribonucleic acid methylation predicts overall survival in gastric cancer. World J Gastroenterol 2020; 26(41): 6414-6430
- URL: https://www.wjgnet.com/1007-9327/full/v26/i41/6414.htm
- DOI: https://dx.doi.org/10.3748/wjg.v26.i41.6414


