Copyright
©The Author(s) 2020.
World J Gastroenterol. Oct 28, 2020; 26(40): 6224-6240
Published online Oct 28, 2020. doi: 10.3748/wjg.v26.i40.6224
Published online Oct 28, 2020. doi: 10.3748/wjg.v26.i40.6224
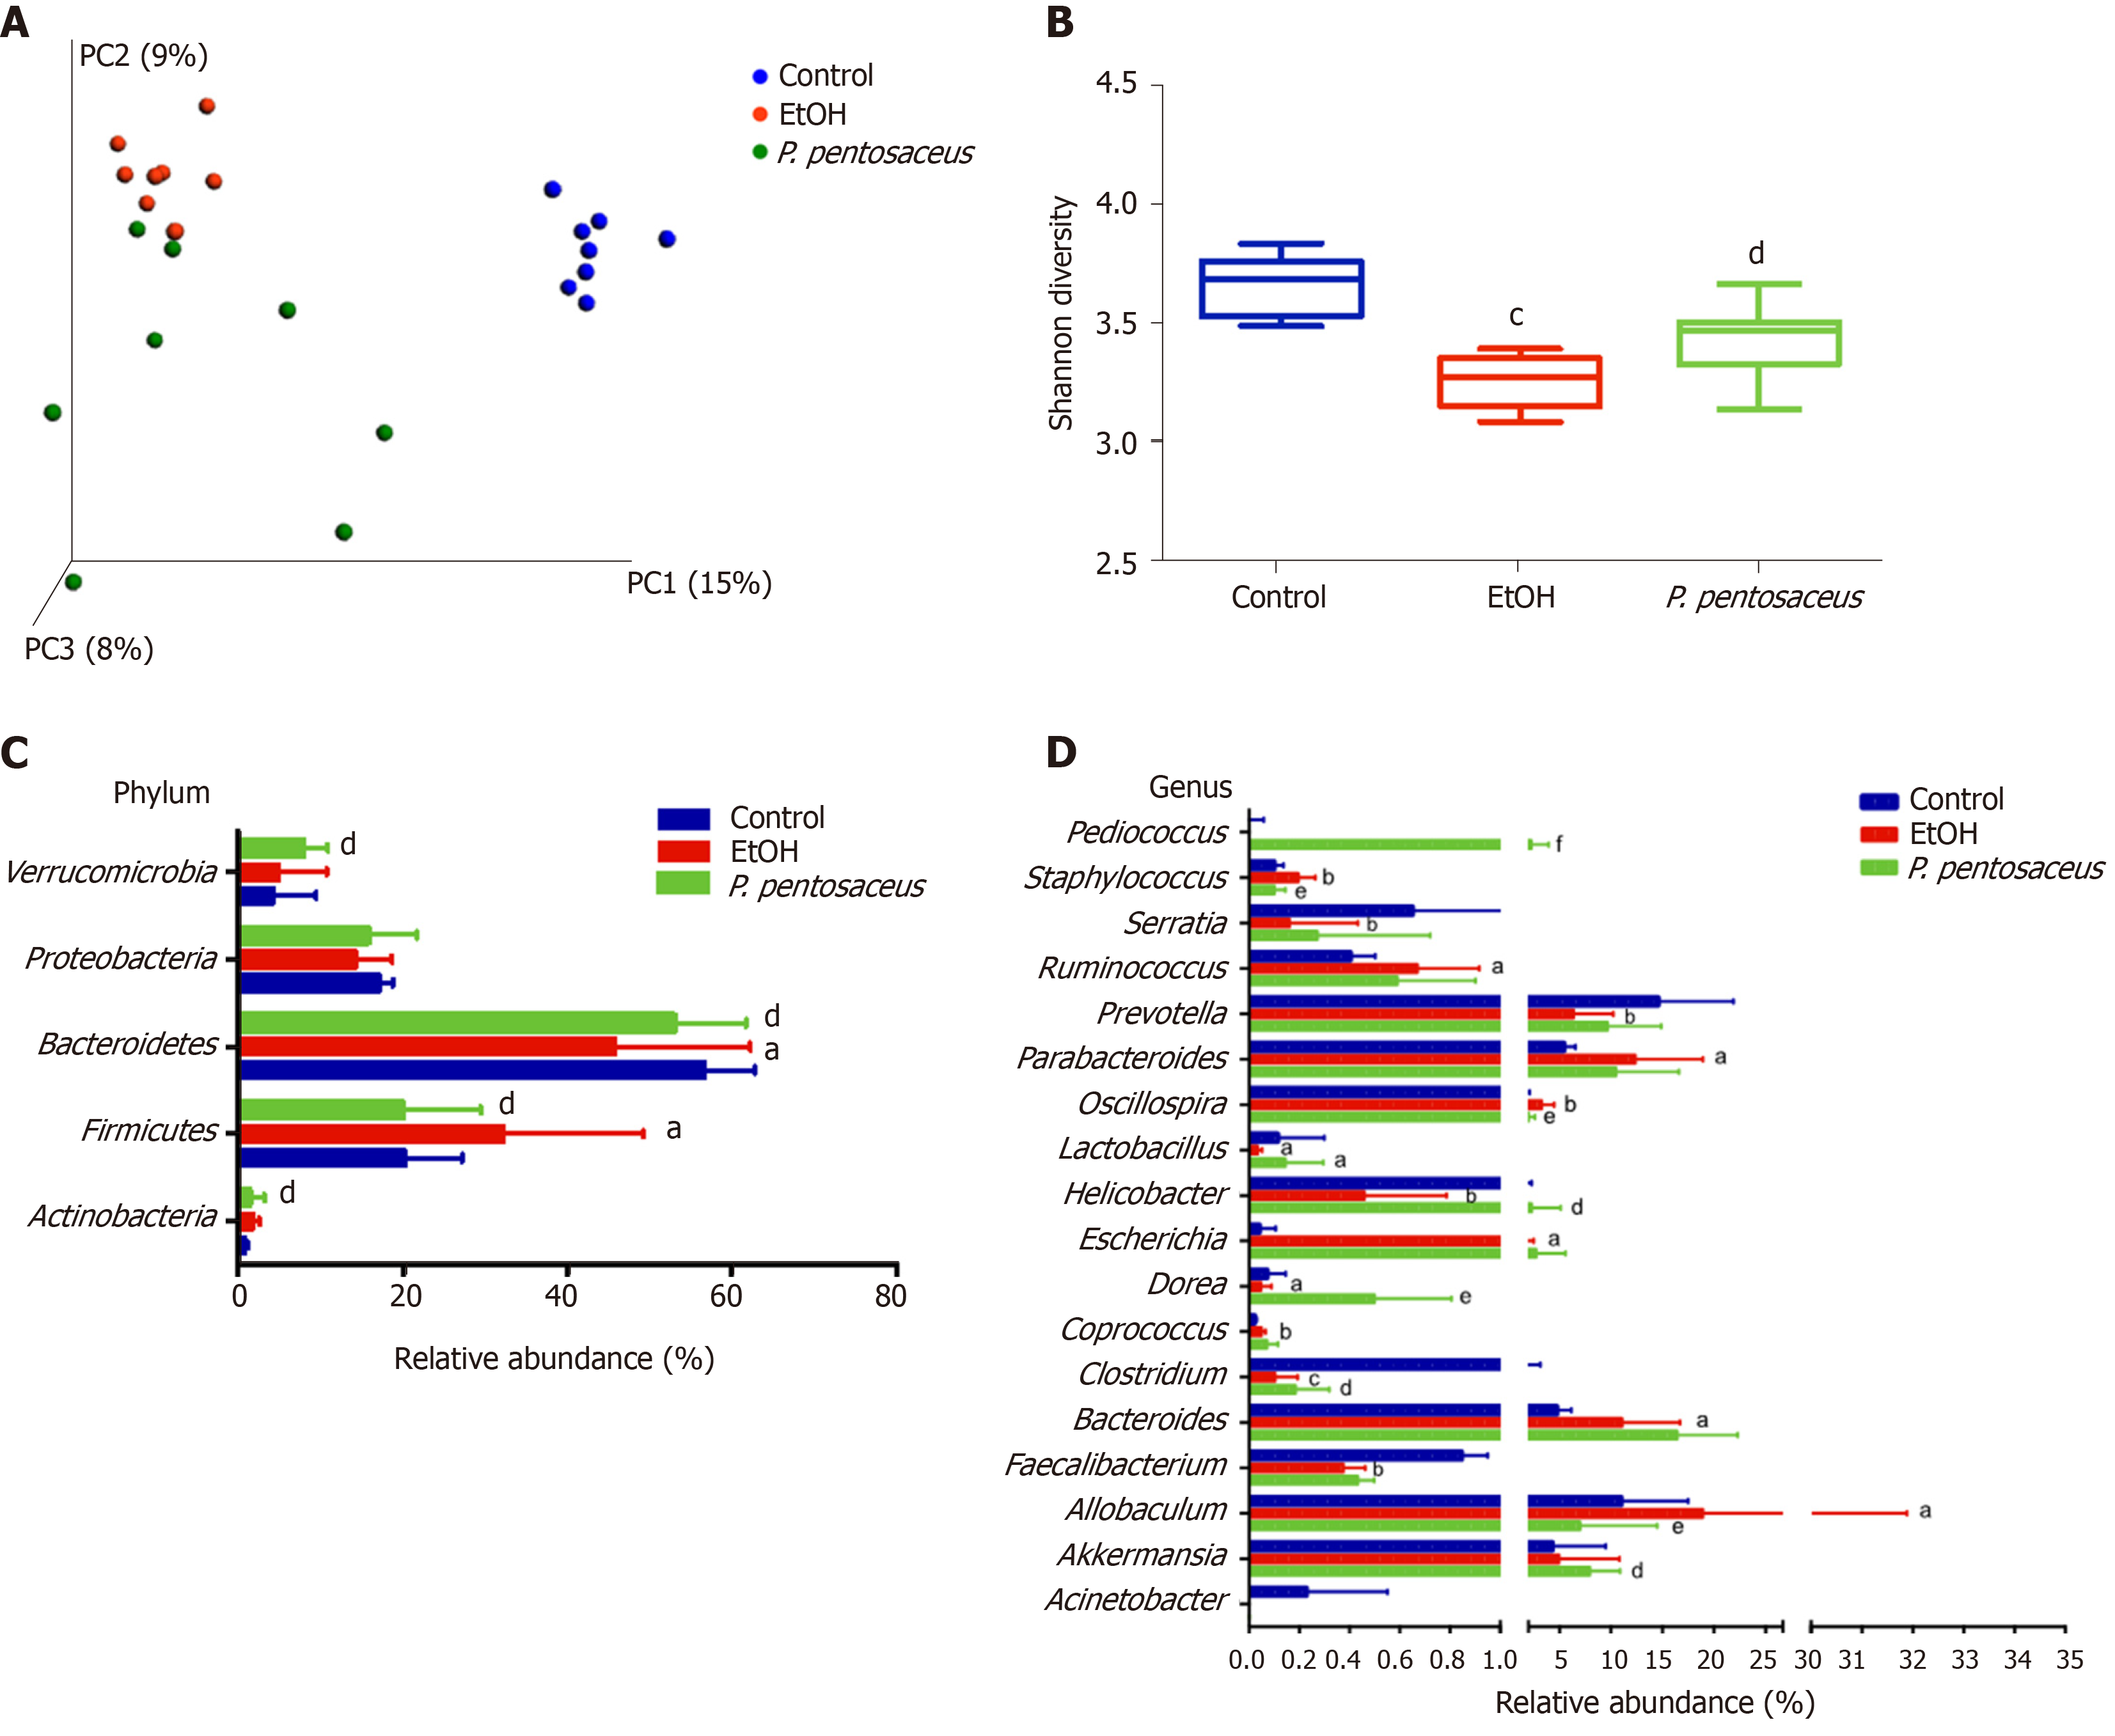
Figure 4 Alterations in the bacterial diversity and microbial composition.
A: Principal co-ordinates analysis plot of the microbiomes of different groups; each symbol represents one sample; B: Shannon diversity indices among the three groups; C: The relative abundance of taxa at the phylum level; D: The relative abundance of taxa at the genus level. All data are presented as means ± SE. aP < 0.05, bP < 0.01, cP < 0.001 vs the Control group. dP < 0.05, eP < 0.01, fP < 0.001 vs the EtOH group. PC: principal co-ordinates; P. pentosaceus: Pediococcus pentosaceus.
- Citation: Jiang XW, Li YT, Ye JZ, Lv LX, Yang LY, Bian XY, Wu WR, Wu JJ, Shi D, Wang Q, Fang DQ, Wang KC, Wang QQ, Lu YM, Xie JJ, Li LJ. New strain of Pediococcus pentosaceus alleviates ethanol-induced liver injury by modulating the gut microbiota and short-chain fatty acid metabolism. World J Gastroenterol 2020; 26(40): 6224-6240
- URL: https://www.wjgnet.com/1007-9327/full/v26/i40/6224.htm
- DOI: https://dx.doi.org/10.3748/wjg.v26.i40.6224


