Copyright
©The Author(s) 2020.
World J Gastroenterol. Oct 14, 2020; 26(38): 5884-5895
Published online Oct 14, 2020. doi: 10.3748/wjg.v26.i38.5884
Published online Oct 14, 2020. doi: 10.3748/wjg.v26.i38.5884
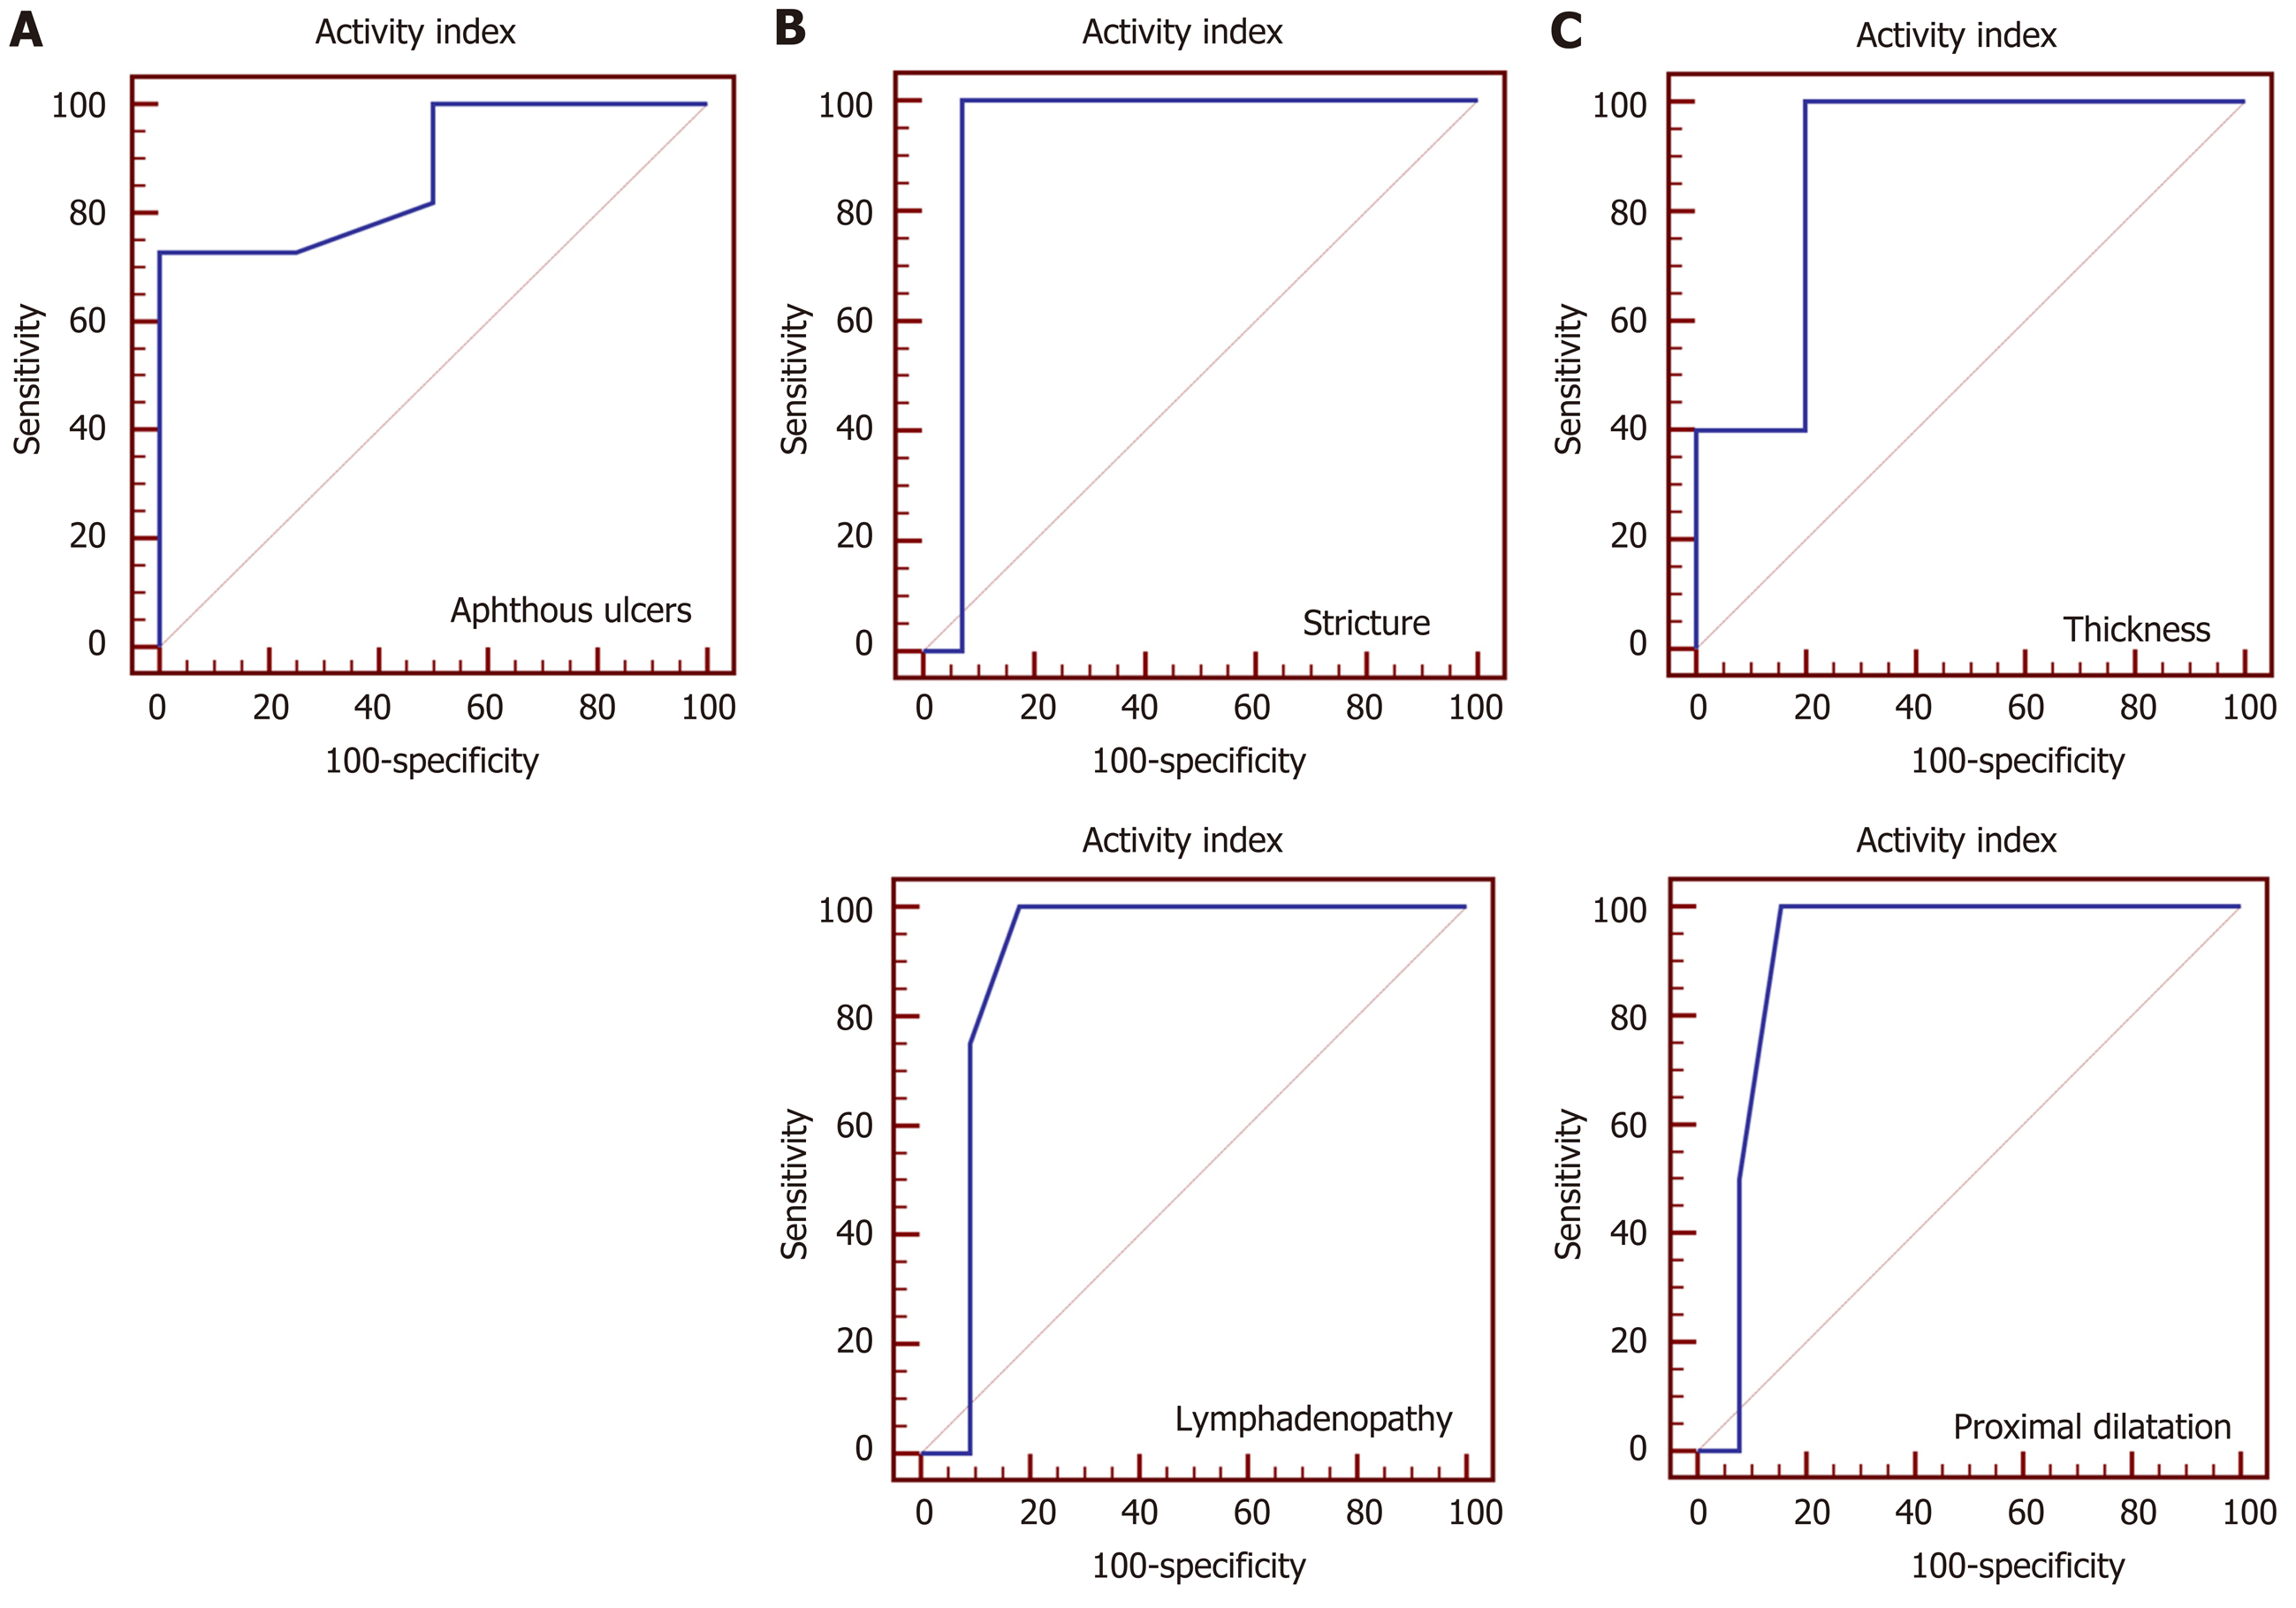
Figure 3 Receiver operating characteristic curve for prediction of active disease.
A: At endoscopy, aphthous ulcers mean area under the receiver operating characteristic (ROC) curve was 0.875 (P < 0.001), positive likelihood ratio infinity, and negative likelihood ratio 0.28; B: Bowel ultrasound showed stricture and lymphadenopathy mean area under the ROC curve were 0.929 (P = 0.036) and 0.898 (P = 0.01) respectively, positive likelihood ratio infinity for both, and negative likelihood ratio 0.94 and 0.71 respectively; C: Magnetic resonance enterography showed thickness and proximal dilatation mean area under the ROC curve were 0.880 (P < 0.001) and 0.904 (P = 0.033) respectively, positive likelihood ratio 1.06 and infinity respectively, and negative likelihood ratio 0.88 for both.
- Citation: Kamel S, Sakr M, Hamed W, Eltabbakh M, Askar S, Bassuny A, Hussein R, Elbaz A. Comparative study between bowel ultrasound and magnetic resonance enterography among Egyptian inflammatory bowel disease patients. World J Gastroenterol 2020; 26(38): 5884-5895
- URL: https://www.wjgnet.com/1007-9327/full/v26/i38/5884.htm
- DOI: https://dx.doi.org/10.3748/wjg.v26.i38.5884


