Copyright
©The Author(s) 2020.
World J Gastroenterol. Oct 14, 2020; 26(38): 5836-5848
Published online Oct 14, 2020. doi: 10.3748/wjg.v26.i38.5836
Published online Oct 14, 2020. doi: 10.3748/wjg.v26.i38.5836
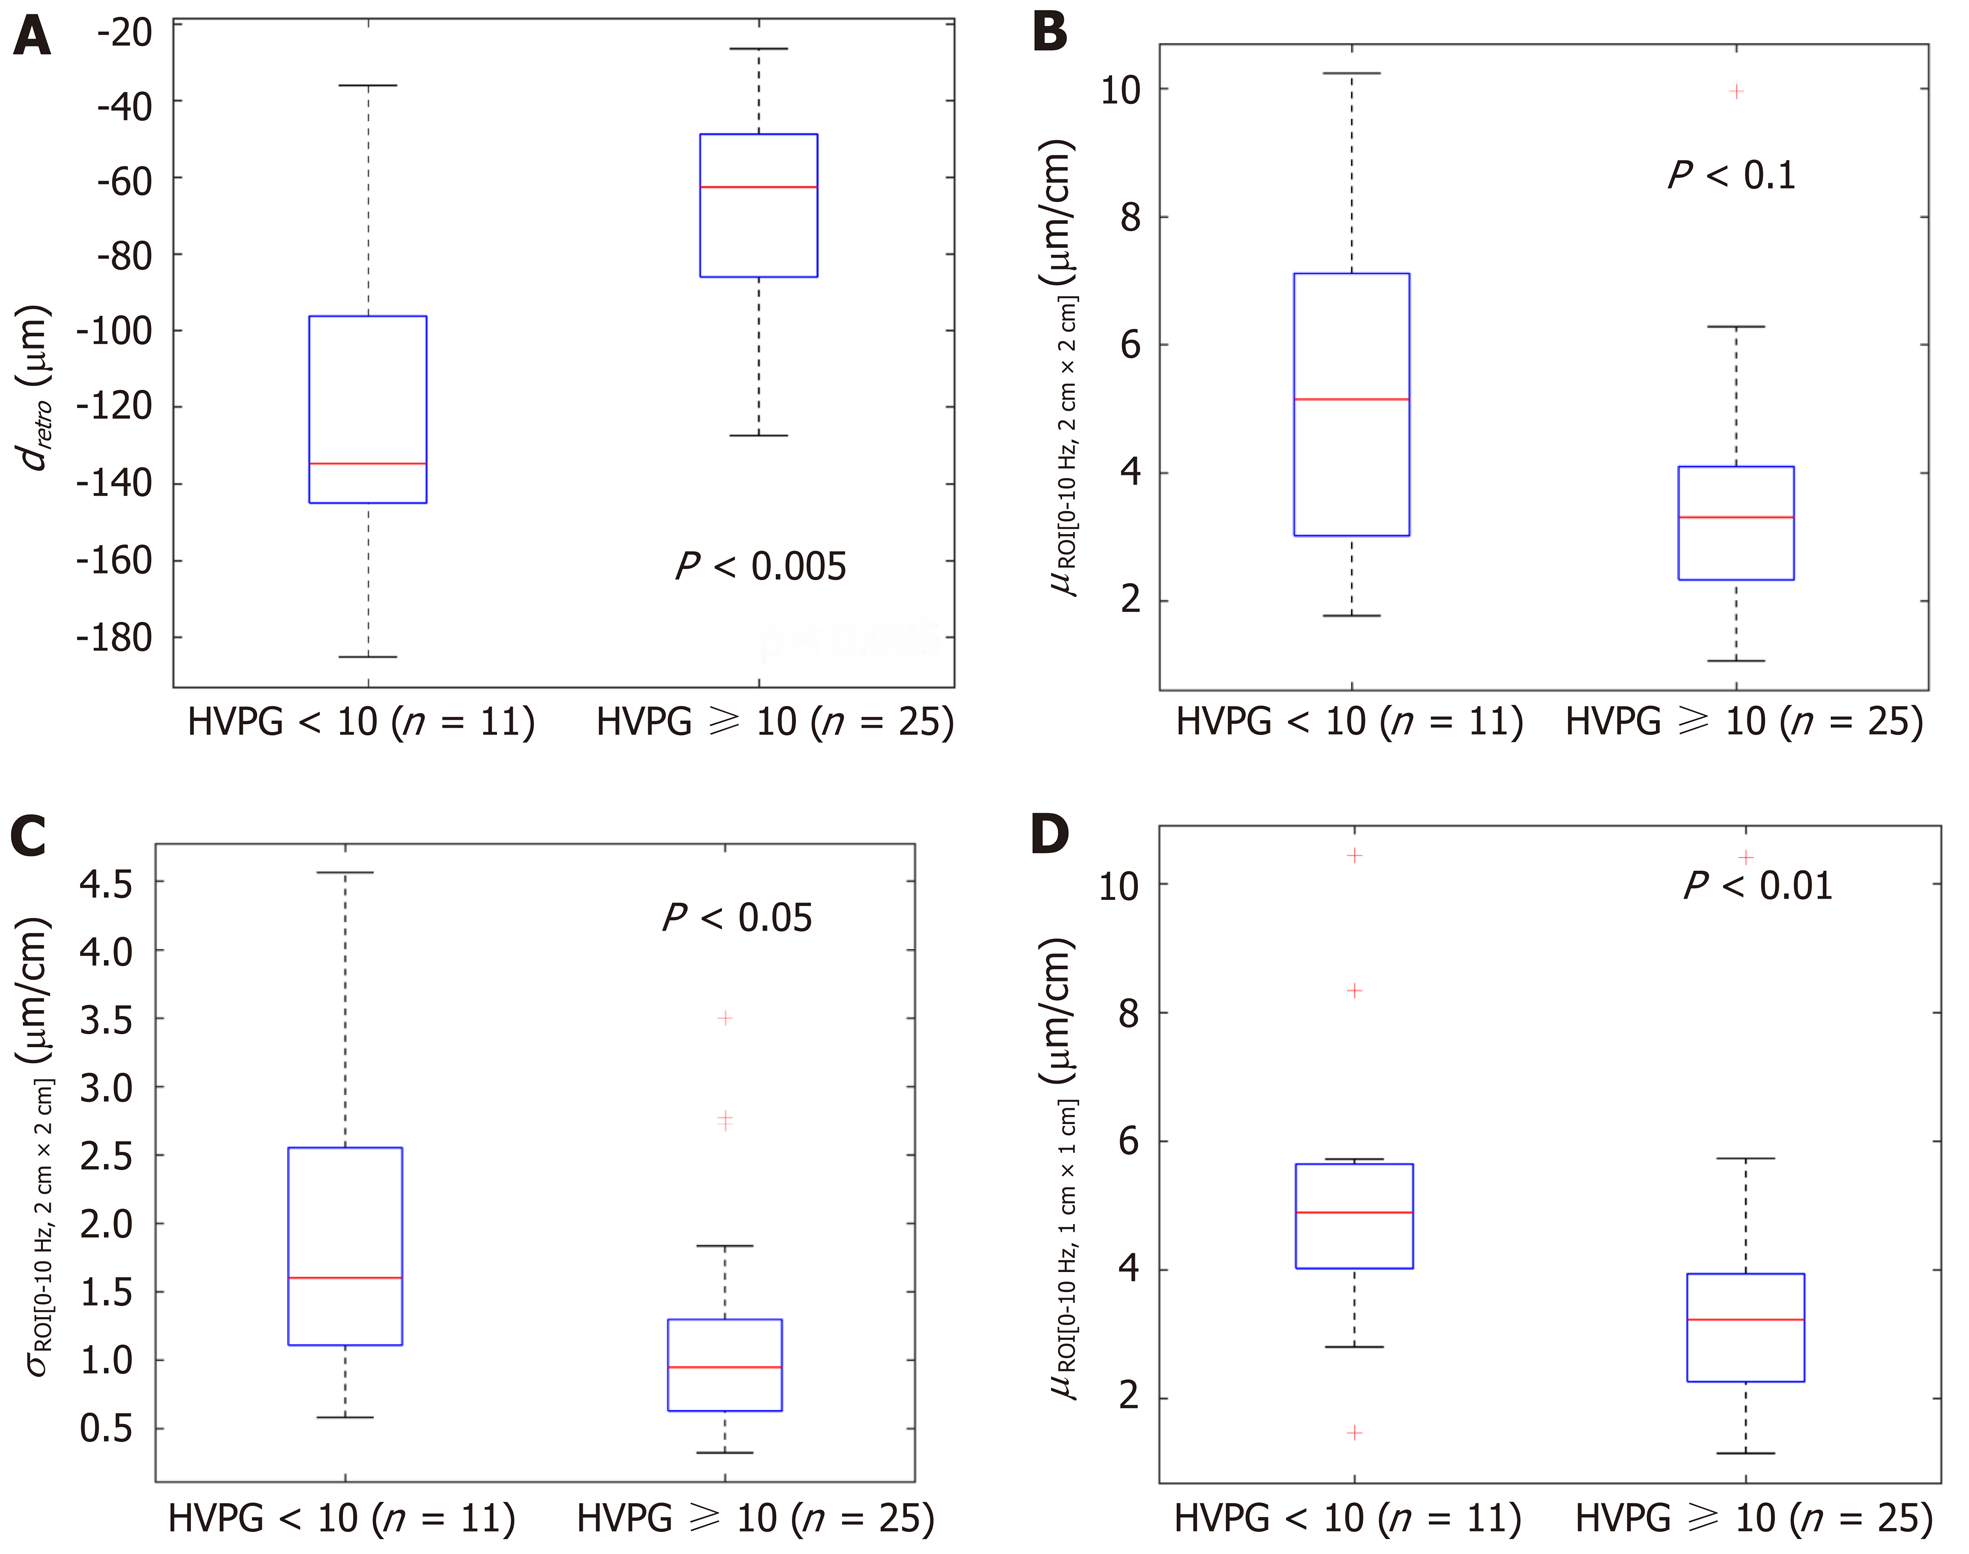
Figure 2 The boxplots and P values representing the derived parameters of endogenous displacements and strain in patients with and without clinically significant portal hypertension (≥ 10 mmHg).
A: dretro; B: µROI[0…10Hz, 2 cm × 2 cm]; C: σROI[0…10Hz, 2 cm × 2 cm]; D: µROI[0…10Hz, 1 cm × 1 cm]. HVPG: Hepatic venous pressure gradient.
- Citation: Gelman S, Sakalauskas A, Zykus R, Pranculis A, Jurkonis R, Kuliavienė I, Lukoševičius A, Kupčinskas L, Kupčinskas J. Endogenous motion of liver correlates to the severity of portal hypertension. World J Gastroenterol 2020; 26(38): 5836-5848
- URL: https://www.wjgnet.com/1007-9327/full/v26/i38/5836.htm
- DOI: https://dx.doi.org/10.3748/wjg.v26.i38.5836


