Copyright
©The Author(s) 2020.
World J Gastroenterol. Oct 7, 2020; 26(37): 5705-5717
Published online Oct 7, 2020. doi: 10.3748/wjg.v26.i37.5705
Published online Oct 7, 2020. doi: 10.3748/wjg.v26.i37.5705
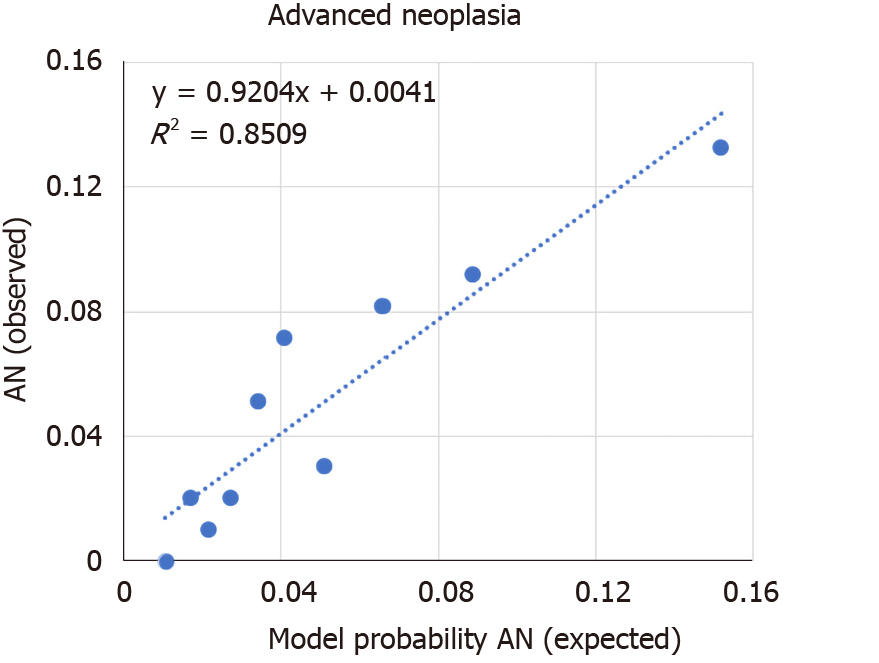
Figure 2 Model calibration plot.
Each data point represents the comparison of observed (y) to expected (x) rates of advanced neoplasia in ten decile size groups (n = 98 each). The dashed line represents the linear trend with the corresponding line equation. (linear trend of y = 0.9204x + 0.0041 ; R2 = 0.8509). AN: Advanced neoplasia.
- Citation: Sharara AI, El Mokahal A, Harb AH, Khalaf N, Sarkis FS, M El-Halabi M, Mansour NM, Malli A, Habib R. Risk prediction rule for advanced neoplasia on screening colonoscopy for average-risk individuals. World J Gastroenterol 2020; 26(37): 5705-5717
- URL: https://www.wjgnet.com/1007-9327/full/v26/i37/5705.htm
- DOI: https://dx.doi.org/10.3748/wjg.v26.i37.5705


