Copyright
©The Author(s) 2020.
World J Gastroenterol. Sep 7, 2020; 26(33): 5008-5021
Published online Sep 7, 2020. doi: 10.3748/wjg.v26.i33.5008
Published online Sep 7, 2020. doi: 10.3748/wjg.v26.i33.5008
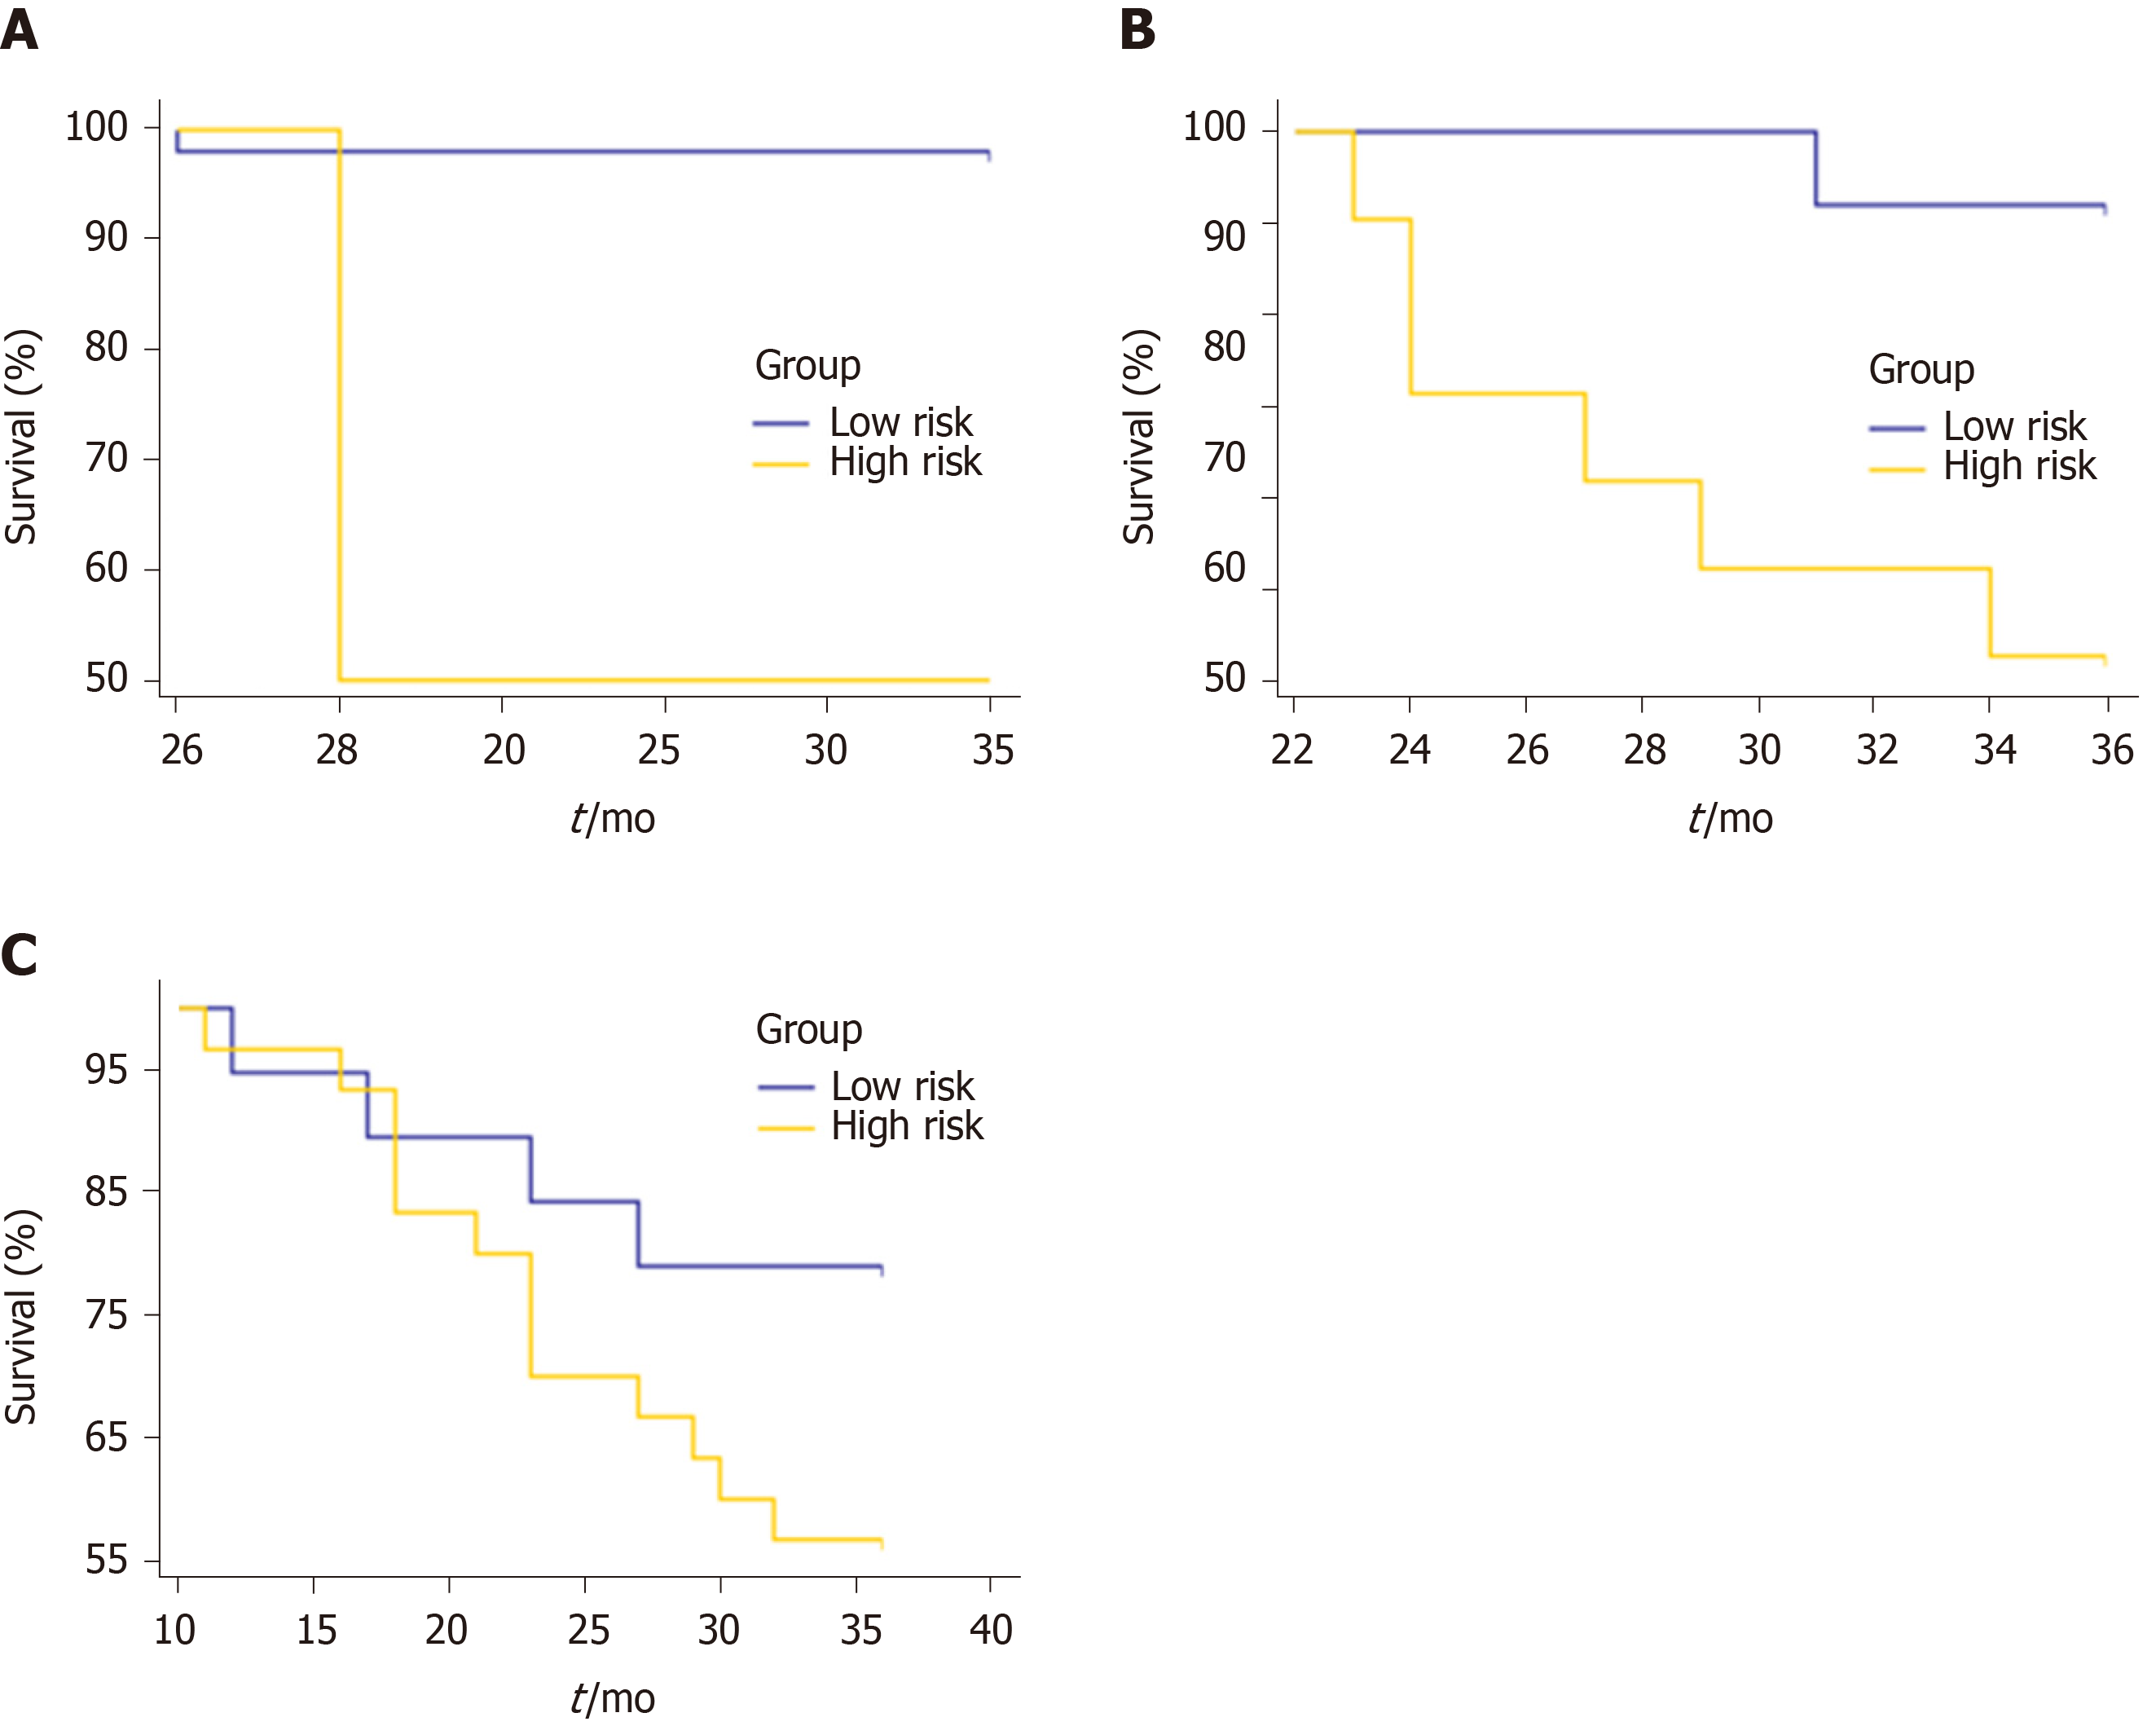
Figure 8 Overall survival curves for the low- and high-risk groups classified according to the combined model in the subgroups of the overall pathological stage.
A: Stage I. P < 0.001; B: Stage II. P = 0.0194; C: Stage III. P = 0.1401.
- Citation: Li M, Zhu YZ, Zhang YC, Yue YF, Yu HP, Song B. Radiomics of rectal cancer for predicting distant metastasis and overall survival. World J Gastroenterol 2020; 26(33): 5008-5021
- URL: https://www.wjgnet.com/1007-9327/full/v26/i33/5008.htm
- DOI: https://dx.doi.org/10.3748/wjg.v26.i33.5008


