Copyright
©The Author(s) 2020.
World J Gastroenterol. Sep 7, 2020; 26(33): 5008-5021
Published online Sep 7, 2020. doi: 10.3748/wjg.v26.i33.5008
Published online Sep 7, 2020. doi: 10.3748/wjg.v26.i33.5008
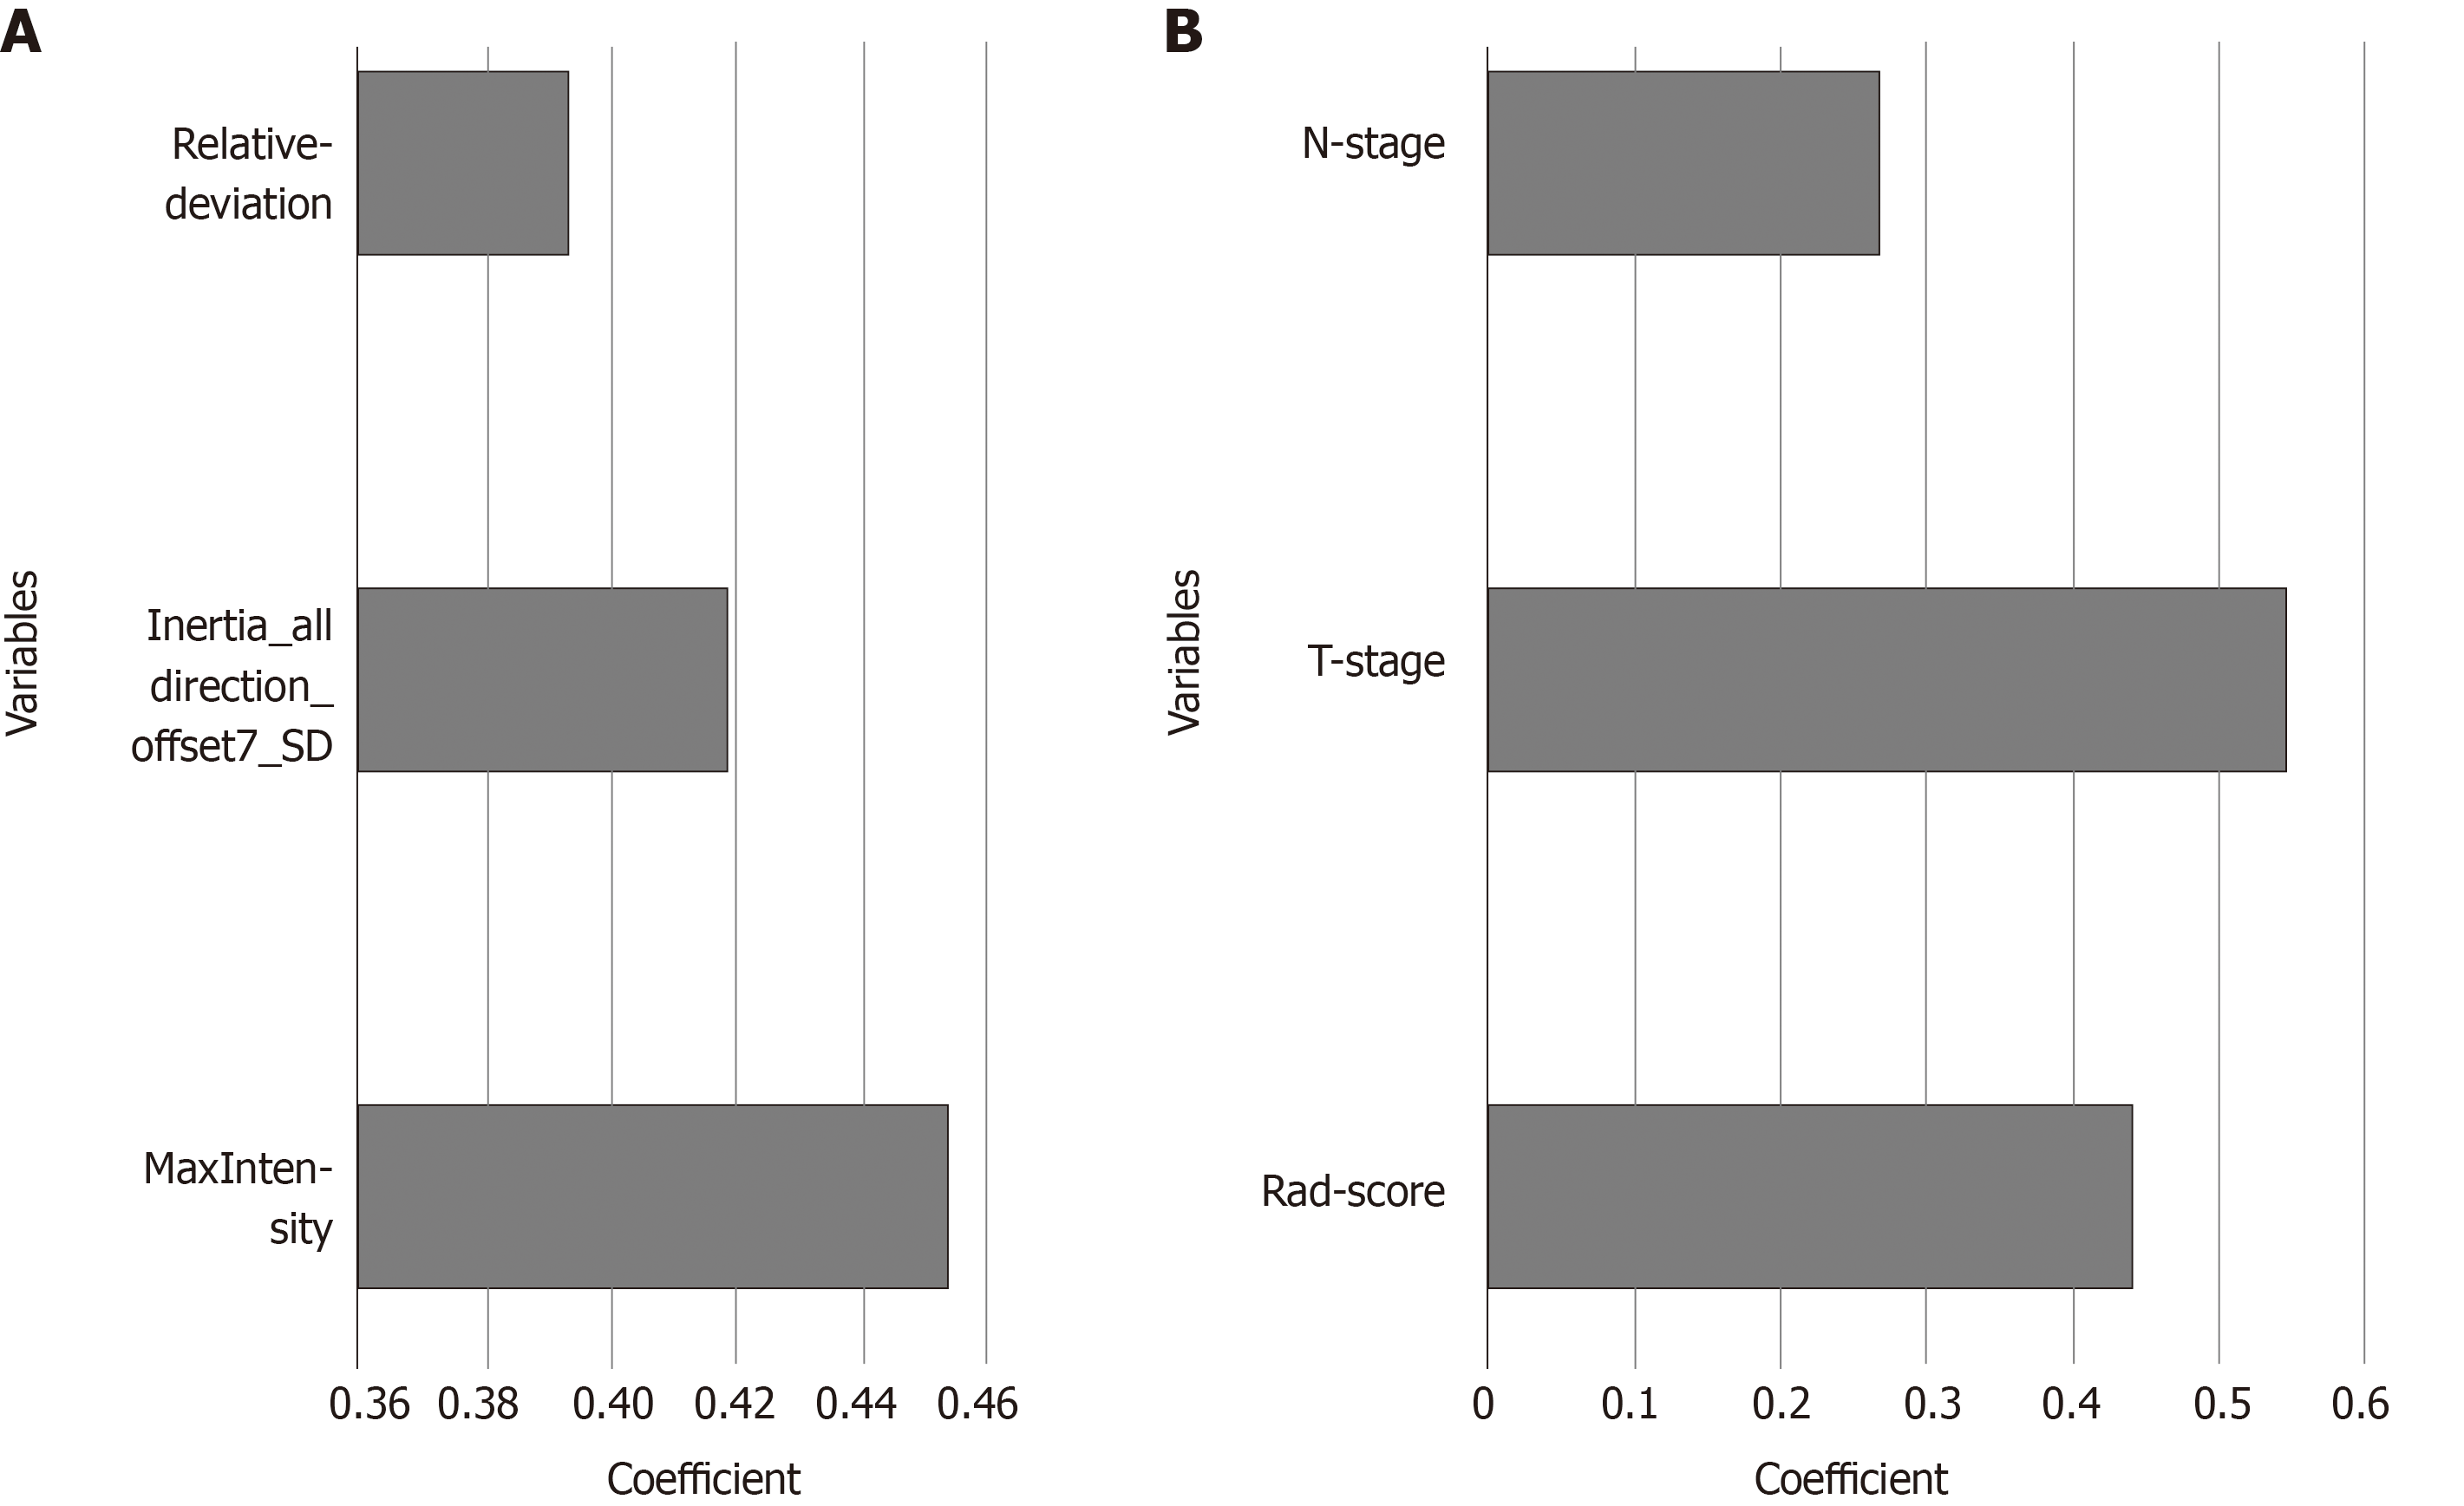
Figure 5 Histogram showing the contribution of each variable to the models.
A: the Rad-score; B: the combined model. The contributions of the variables were measured by the values of the standardized logistic regression coefficients.
- Citation: Li M, Zhu YZ, Zhang YC, Yue YF, Yu HP, Song B. Radiomics of rectal cancer for predicting distant metastasis and overall survival. World J Gastroenterol 2020; 26(33): 5008-5021
- URL: https://www.wjgnet.com/1007-9327/full/v26/i33/5008.htm
- DOI: https://dx.doi.org/10.3748/wjg.v26.i33.5008


