Copyright
©The Author(s) 2020.
World J Gastroenterol. Sep 7, 2020; 26(33): 4996-5007
Published online Sep 7, 2020. doi: 10.3748/wjg.v26.i33.4996
Published online Sep 7, 2020. doi: 10.3748/wjg.v26.i33.4996
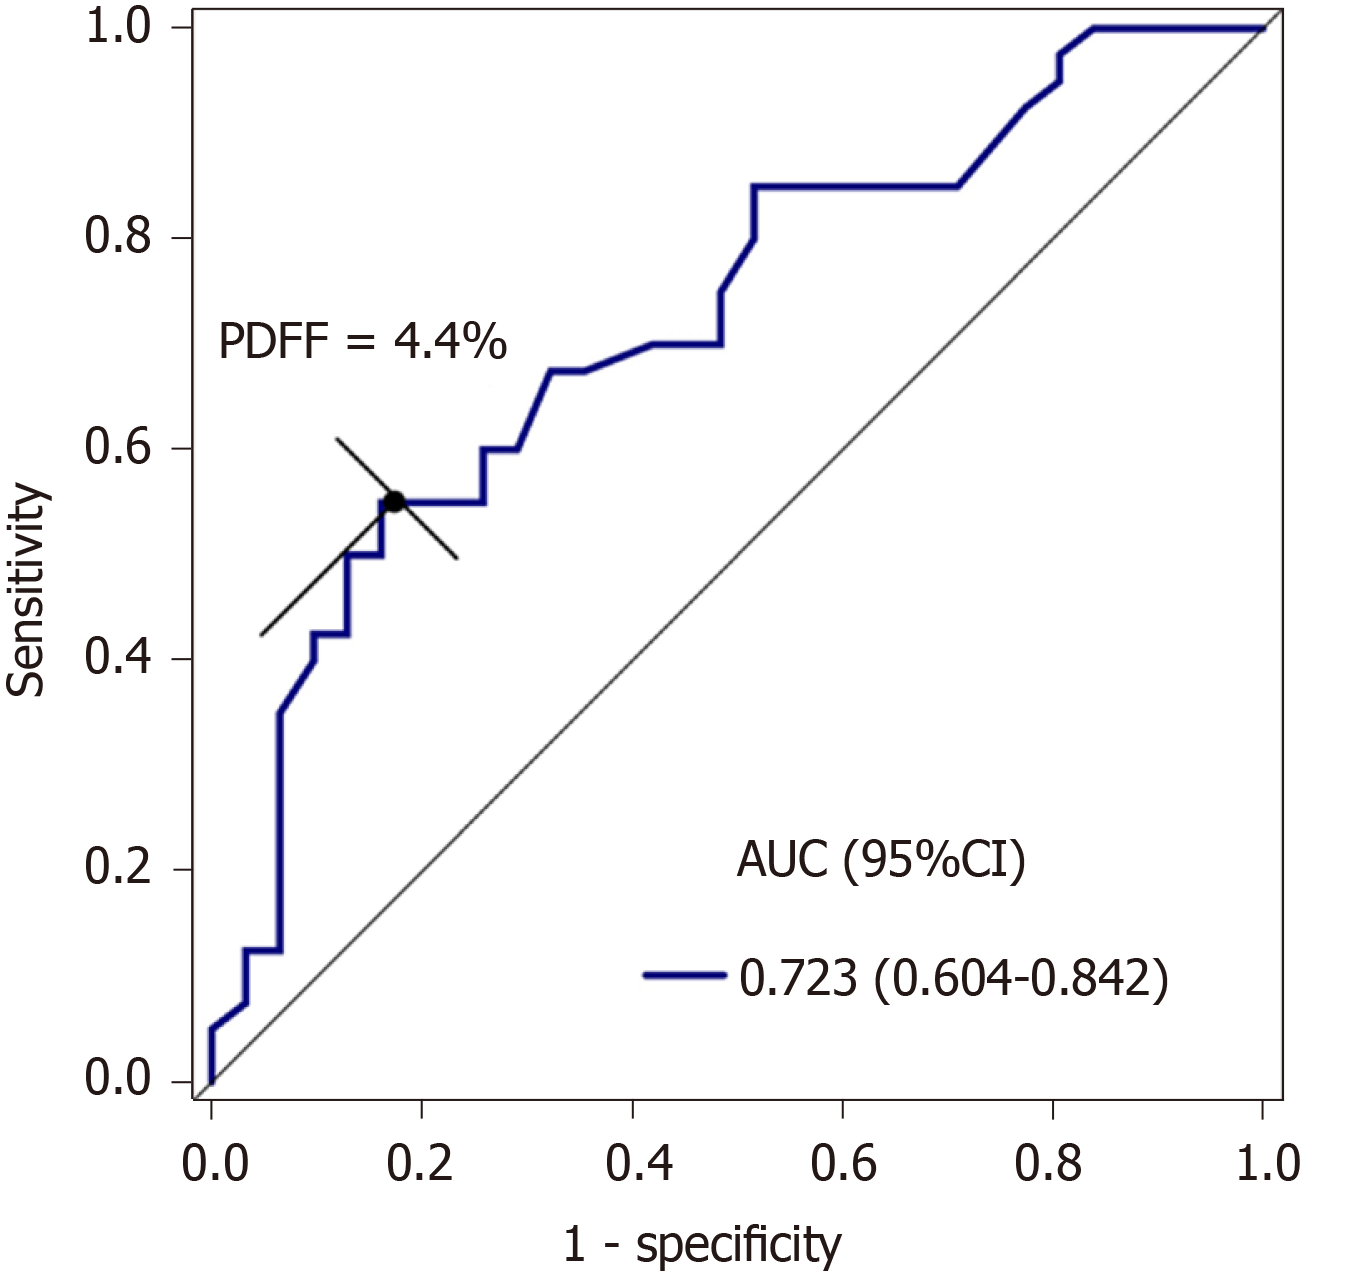
Figure 4 Receiver operating characteristic curve shows that the area under the curve of proton density fat fraction was 0.
723 (95% confidence interval: 0.604-0.842) at a cut-off of 4.4% for discriminating cholelithiasis from healthy controls, with a sensitivity of 55.0% and specificity of 83.9%. PDFF: Proton density fat fraction; CI: Confidence interval; AUC: Area under the curve.
- Citation: Chen H, Zeng WK, Shi GZ, Gao M, Wang MZ, Shen J. Liver fat accumulation measured by high-speed T2-corrected multi-echo magnetic resonance spectroscopy can predict risk of cholelithiasis. World J Gastroenterol 2020; 26(33): 4996-5007
- URL: https://www.wjgnet.com/1007-9327/full/v26/i33/4996.htm
- DOI: https://dx.doi.org/10.3748/wjg.v26.i33.4996


