Copyright
©The Author(s) 2020.
World J Gastroenterol. Sep 7, 2020; 26(33): 4996-5007
Published online Sep 7, 2020. doi: 10.3748/wjg.v26.i33.4996
Published online Sep 7, 2020. doi: 10.3748/wjg.v26.i33.4996
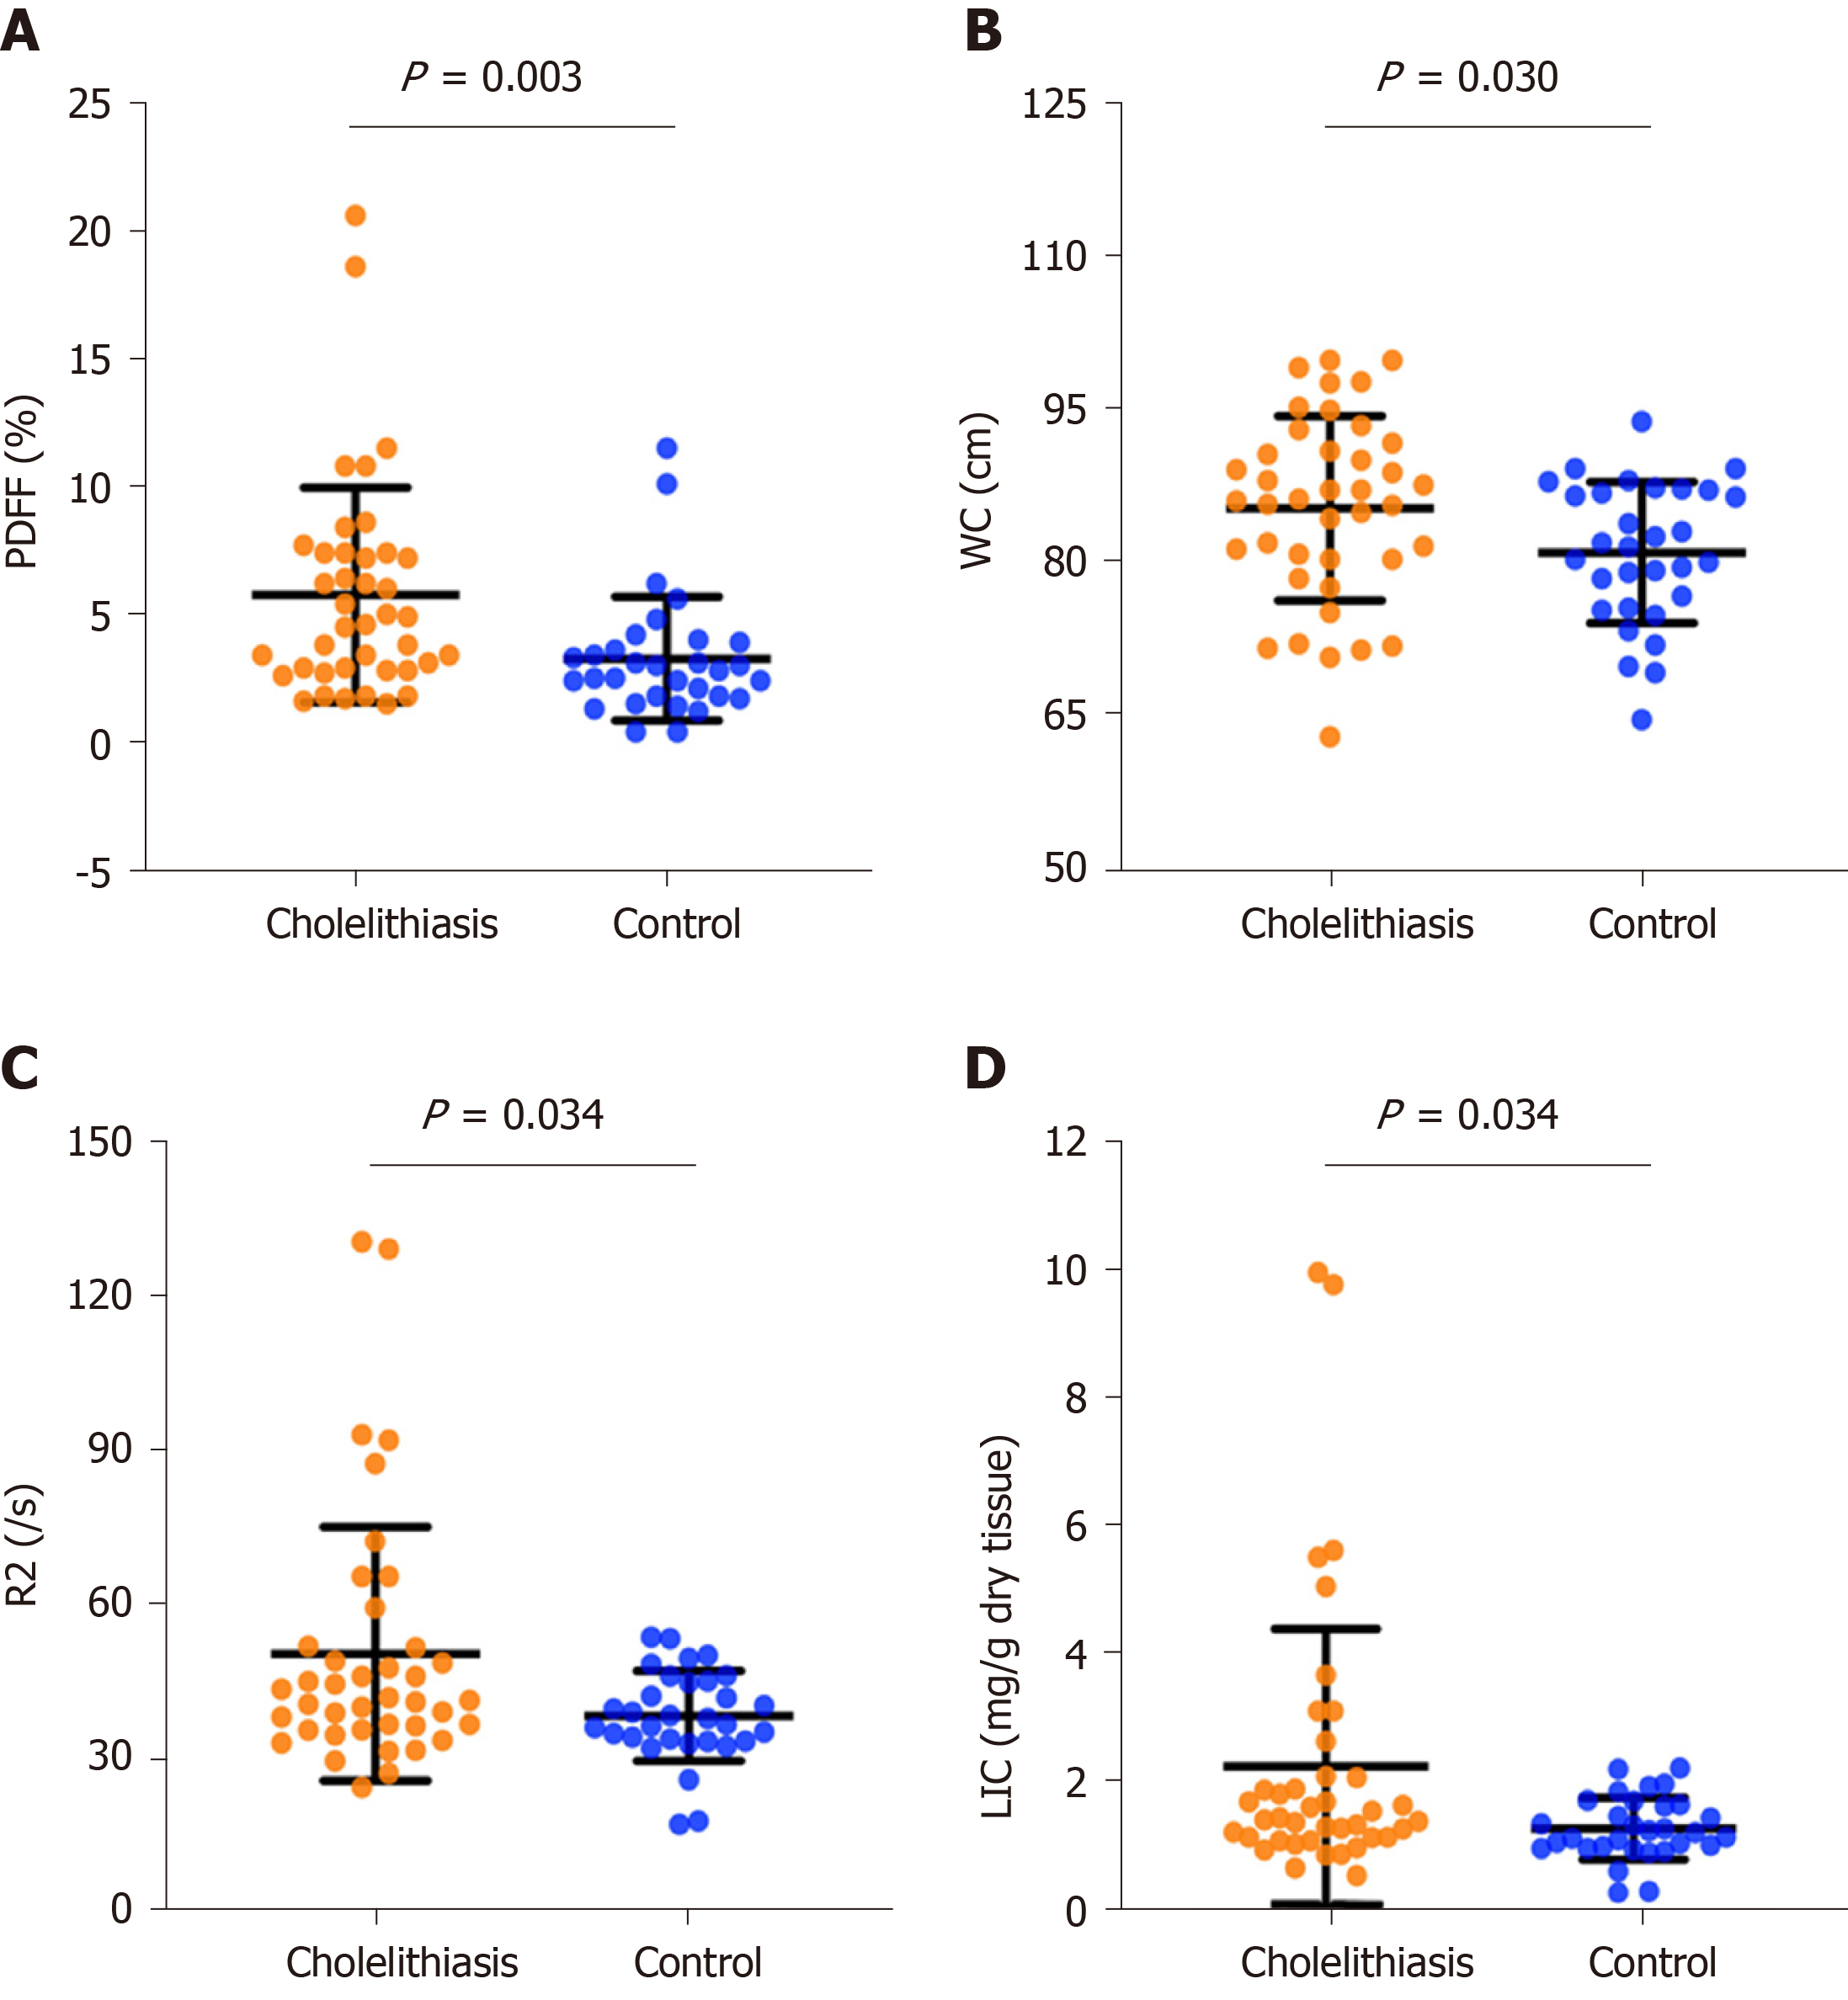
Figure 2 Graphs show proton density fat fraction (A), waist circumference (B), R2 (C), and liver iron concentration (D) values in the cholelithiasis group and healthy controls.
Variables are presented as the mean ± standard deviation. PDFF: Proton density fat fraction; WC: Waist circumference; LIC: Liver iron concentration.
- Citation: Chen H, Zeng WK, Shi GZ, Gao M, Wang MZ, Shen J. Liver fat accumulation measured by high-speed T2-corrected multi-echo magnetic resonance spectroscopy can predict risk of cholelithiasis. World J Gastroenterol 2020; 26(33): 4996-5007
- URL: https://www.wjgnet.com/1007-9327/full/v26/i33/4996.htm
- DOI: https://dx.doi.org/10.3748/wjg.v26.i33.4996


