Copyright
©The Author(s) 2020.
World J Gastroenterol. Sep 7, 2020; 26(33): 4996-5007
Published online Sep 7, 2020. doi: 10.3748/wjg.v26.i33.4996
Published online Sep 7, 2020. doi: 10.3748/wjg.v26.i33.4996
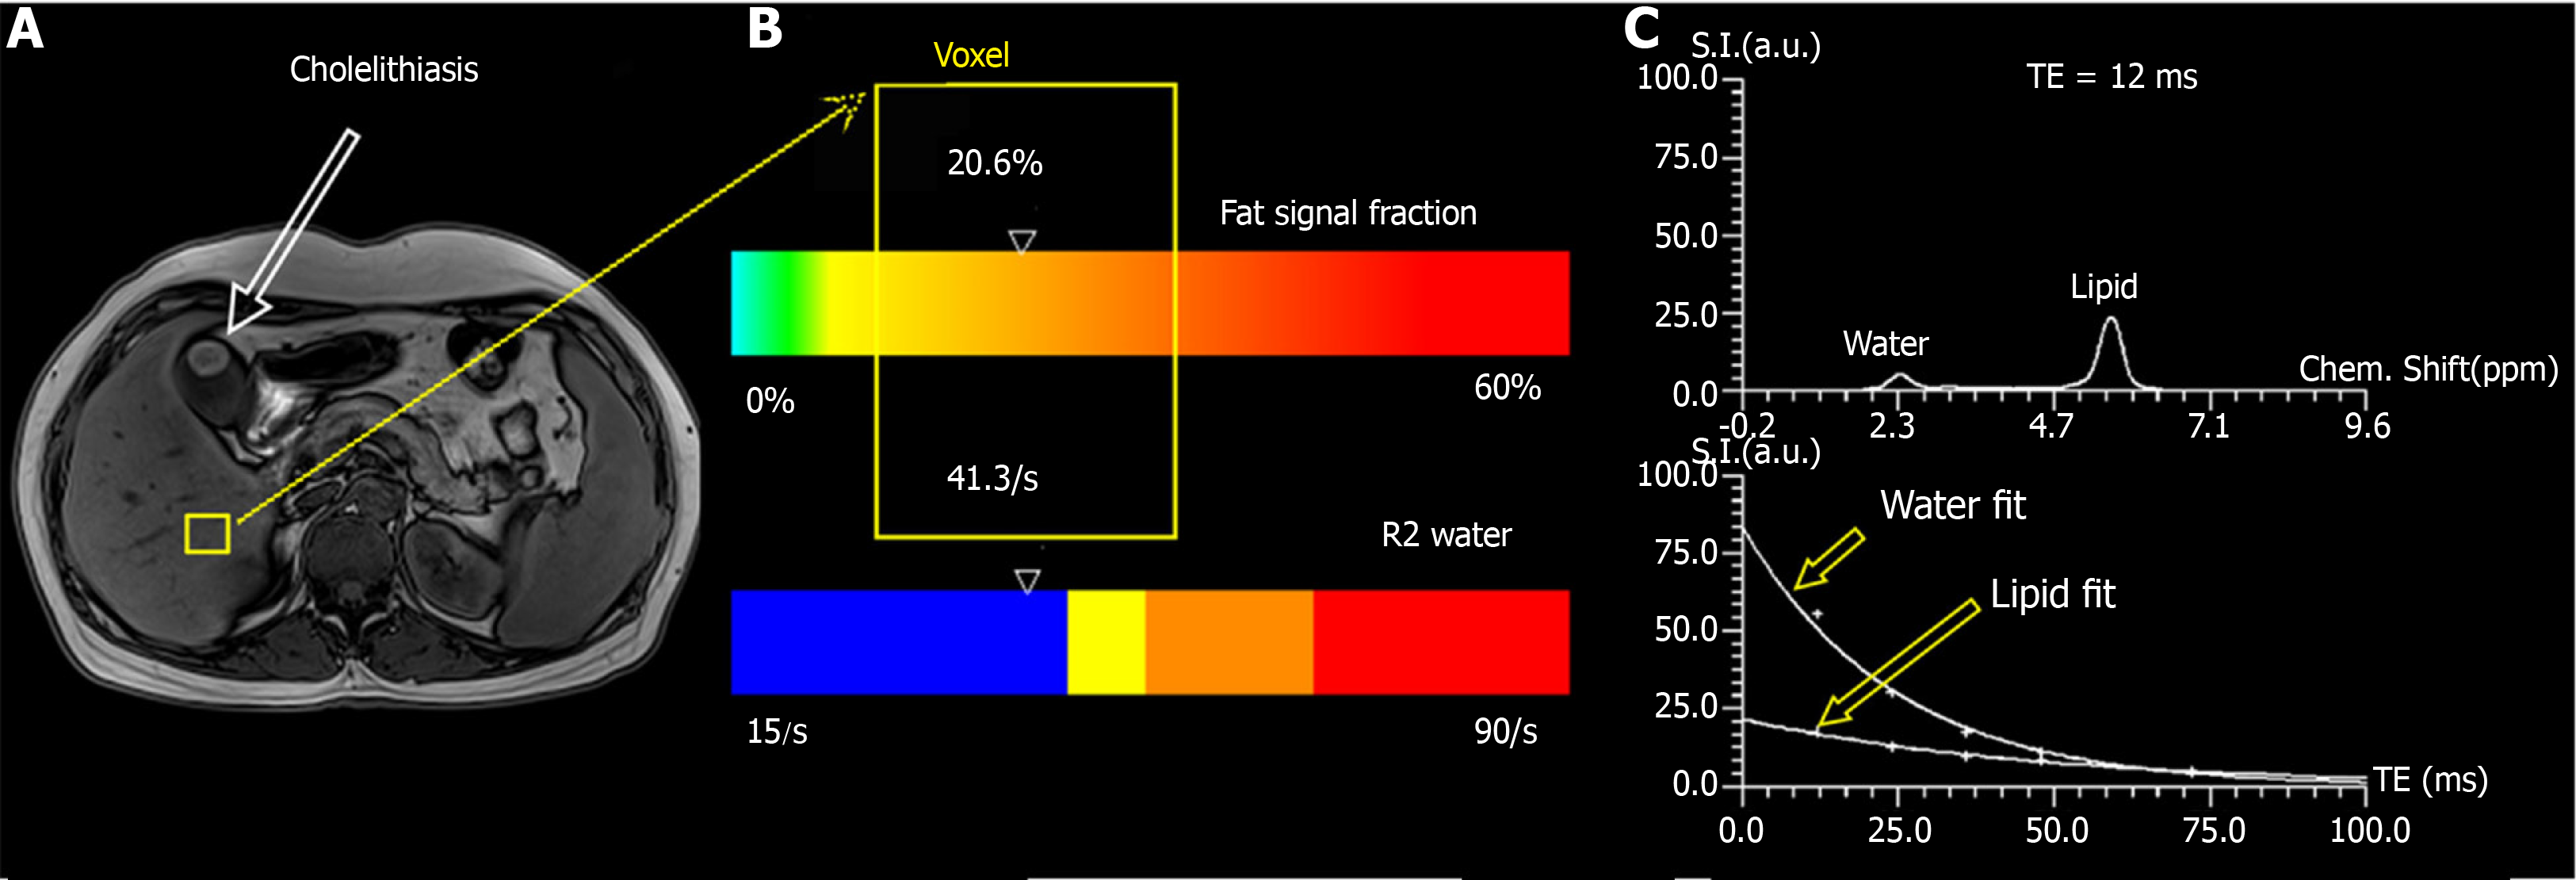
Figure 1 Measurement of proton density fat fraction and R2 values using T2-corrected multi-echo single-voxel 1H-magnetic resonance spectroscopy.
A: The voxel of liver (yellow square) is shown in a 43-year-old man with cholelithiasis; B: Results are presented as a colored bar indicating the corresponding values of proton density fat fraction and R2 (yellow box), and the value of PDFF and R2 was 20.6% and 41.3/s, respectively; C: The water and fat spectra for T2 = 12 ms and the exponential decay fit for the five echoes. Upper image: Representative spectrum of water and lipid. Lower image: Graph of T2 decay of water and lipid shows marked differences in decay rate and signal integrals from water and lipid spectrum fits were used to measure T2 decay and estimate the equilibrium signal.
- Citation: Chen H, Zeng WK, Shi GZ, Gao M, Wang MZ, Shen J. Liver fat accumulation measured by high-speed T2-corrected multi-echo magnetic resonance spectroscopy can predict risk of cholelithiasis. World J Gastroenterol 2020; 26(33): 4996-5007
- URL: https://www.wjgnet.com/1007-9327/full/v26/i33/4996.htm
- DOI: https://dx.doi.org/10.3748/wjg.v26.i33.4996


