Copyright
©The Author(s) 2020.
World J Gastroenterol. Aug 21, 2020; 26(31): 4607-4623
Published online Aug 21, 2020. doi: 10.3748/wjg.v26.i31.4607
Published online Aug 21, 2020. doi: 10.3748/wjg.v26.i31.4607
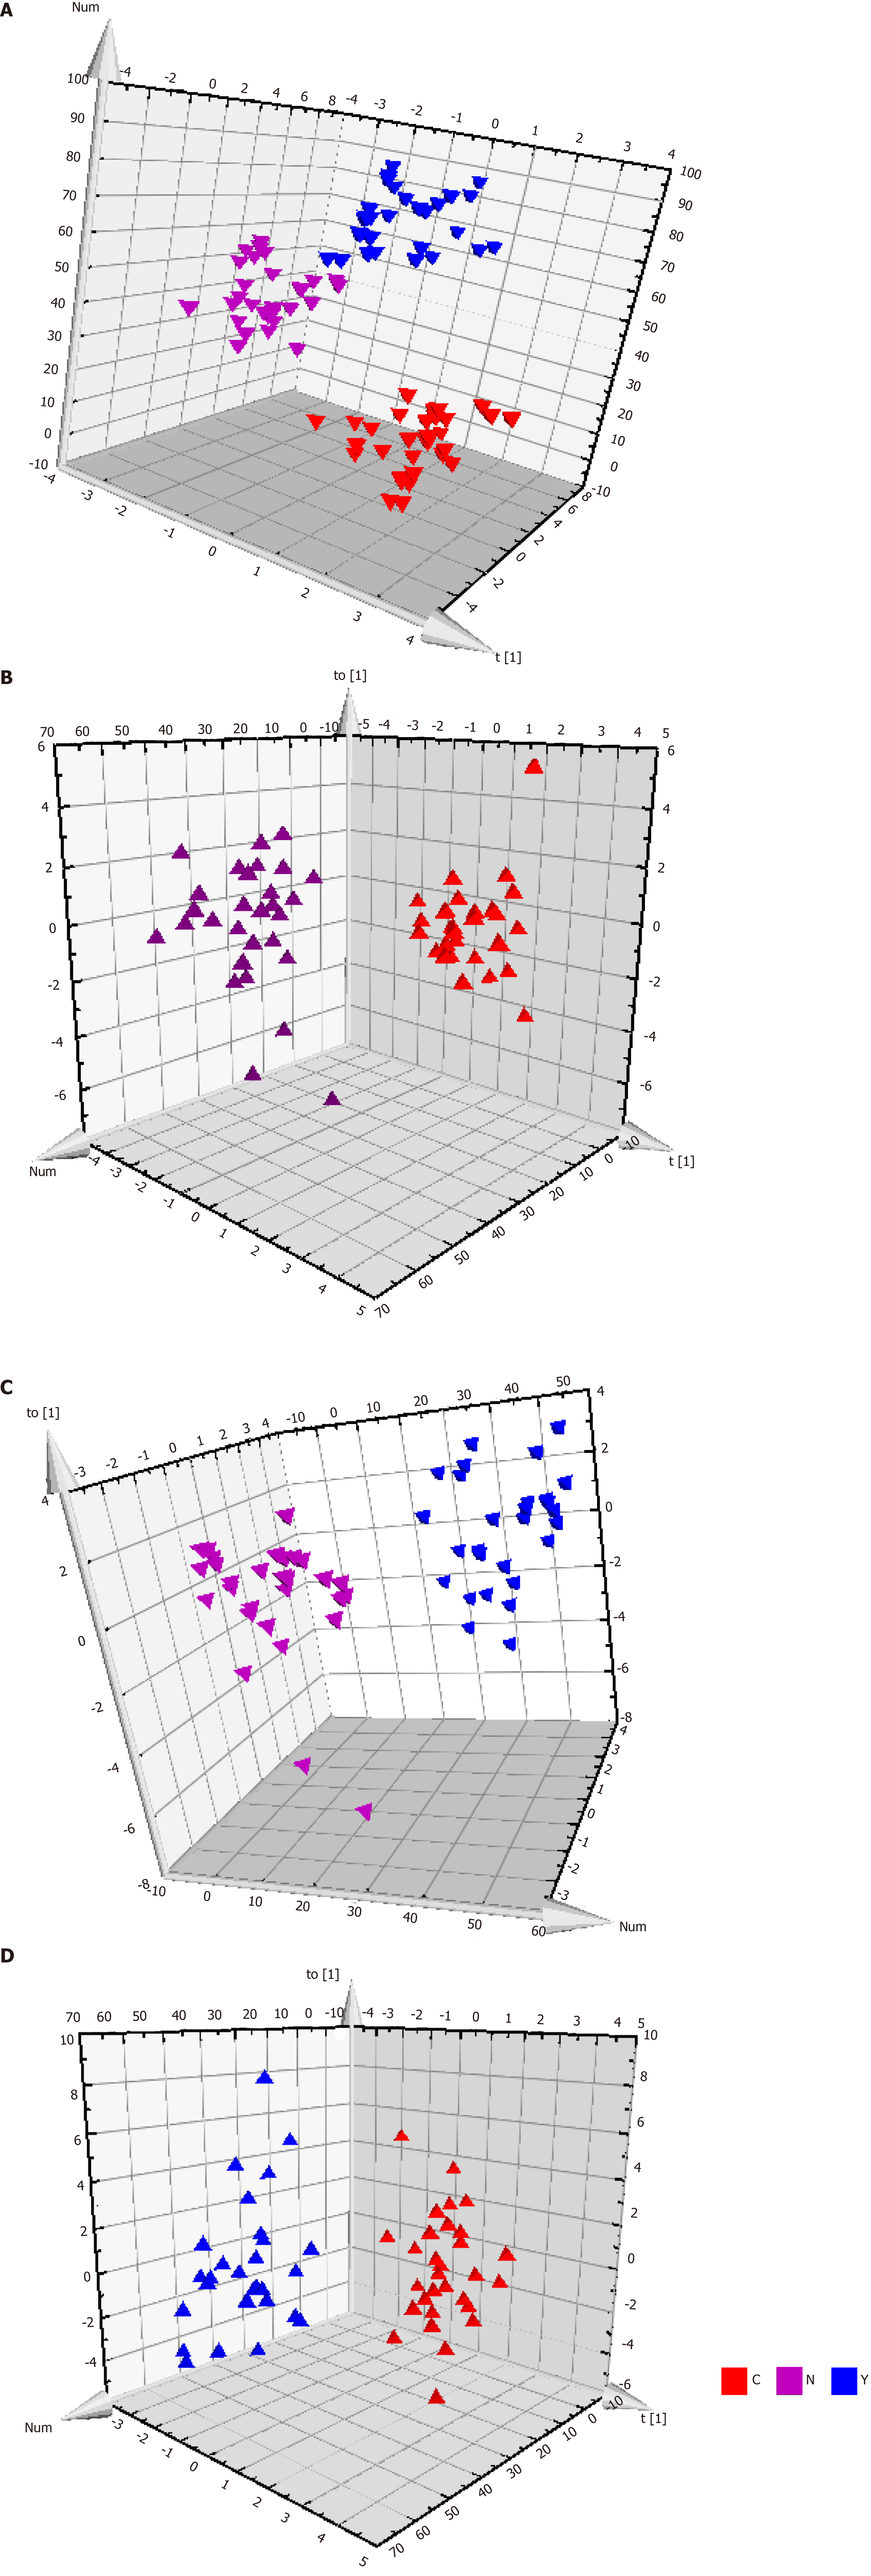
Figure 3 Metabolic profiles of serum from hepatocellular carcinoma patients, cirrhosis patients and healthy controls.
A: The orthogonal partial least squares discriminant analysis (OPLS-DA) score plot for all the three groups. Model efficiency: R2X = 0.370 cum, R2Y = 0.838 cum, Q2 = 0.467 cum; B: The OPLS-DA score plot of C group and N group. R2X = 0.187 cum, R2Y = 0.790 cum, Q2 = 0.603 cum; C: The OPLS-DA score plot of Y group and N group. R2X = 0.559 cum, R2Y = 0.962 cum, Q2 = 0.696 cum; and D: The OPLS-DA score plot of C group and Y group. R2X = 0.274 cum, R2Y = 0.812 cum, Q2 = 0.358 cum. OPLS-DA: Orthogonal partial least squares discriminant analysis.
- Citation: Zhou PC, Sun LQ, Shao L, Yi LZ, Li N, Fan XG. Establishment of a pattern recognition metabolomics model for the diagnosis of hepatocellular carcinoma. World J Gastroenterol 2020; 26(31): 4607-4623
- URL: https://www.wjgnet.com/1007-9327/full/v26/i31/4607.htm
- DOI: https://dx.doi.org/10.3748/wjg.v26.i31.4607


