Copyright
©The Author(s) 2020.
World J Gastroenterol. Aug 21, 2020; 26(31): 4607-4623
Published online Aug 21, 2020. doi: 10.3748/wjg.v26.i31.4607
Published online Aug 21, 2020. doi: 10.3748/wjg.v26.i31.4607
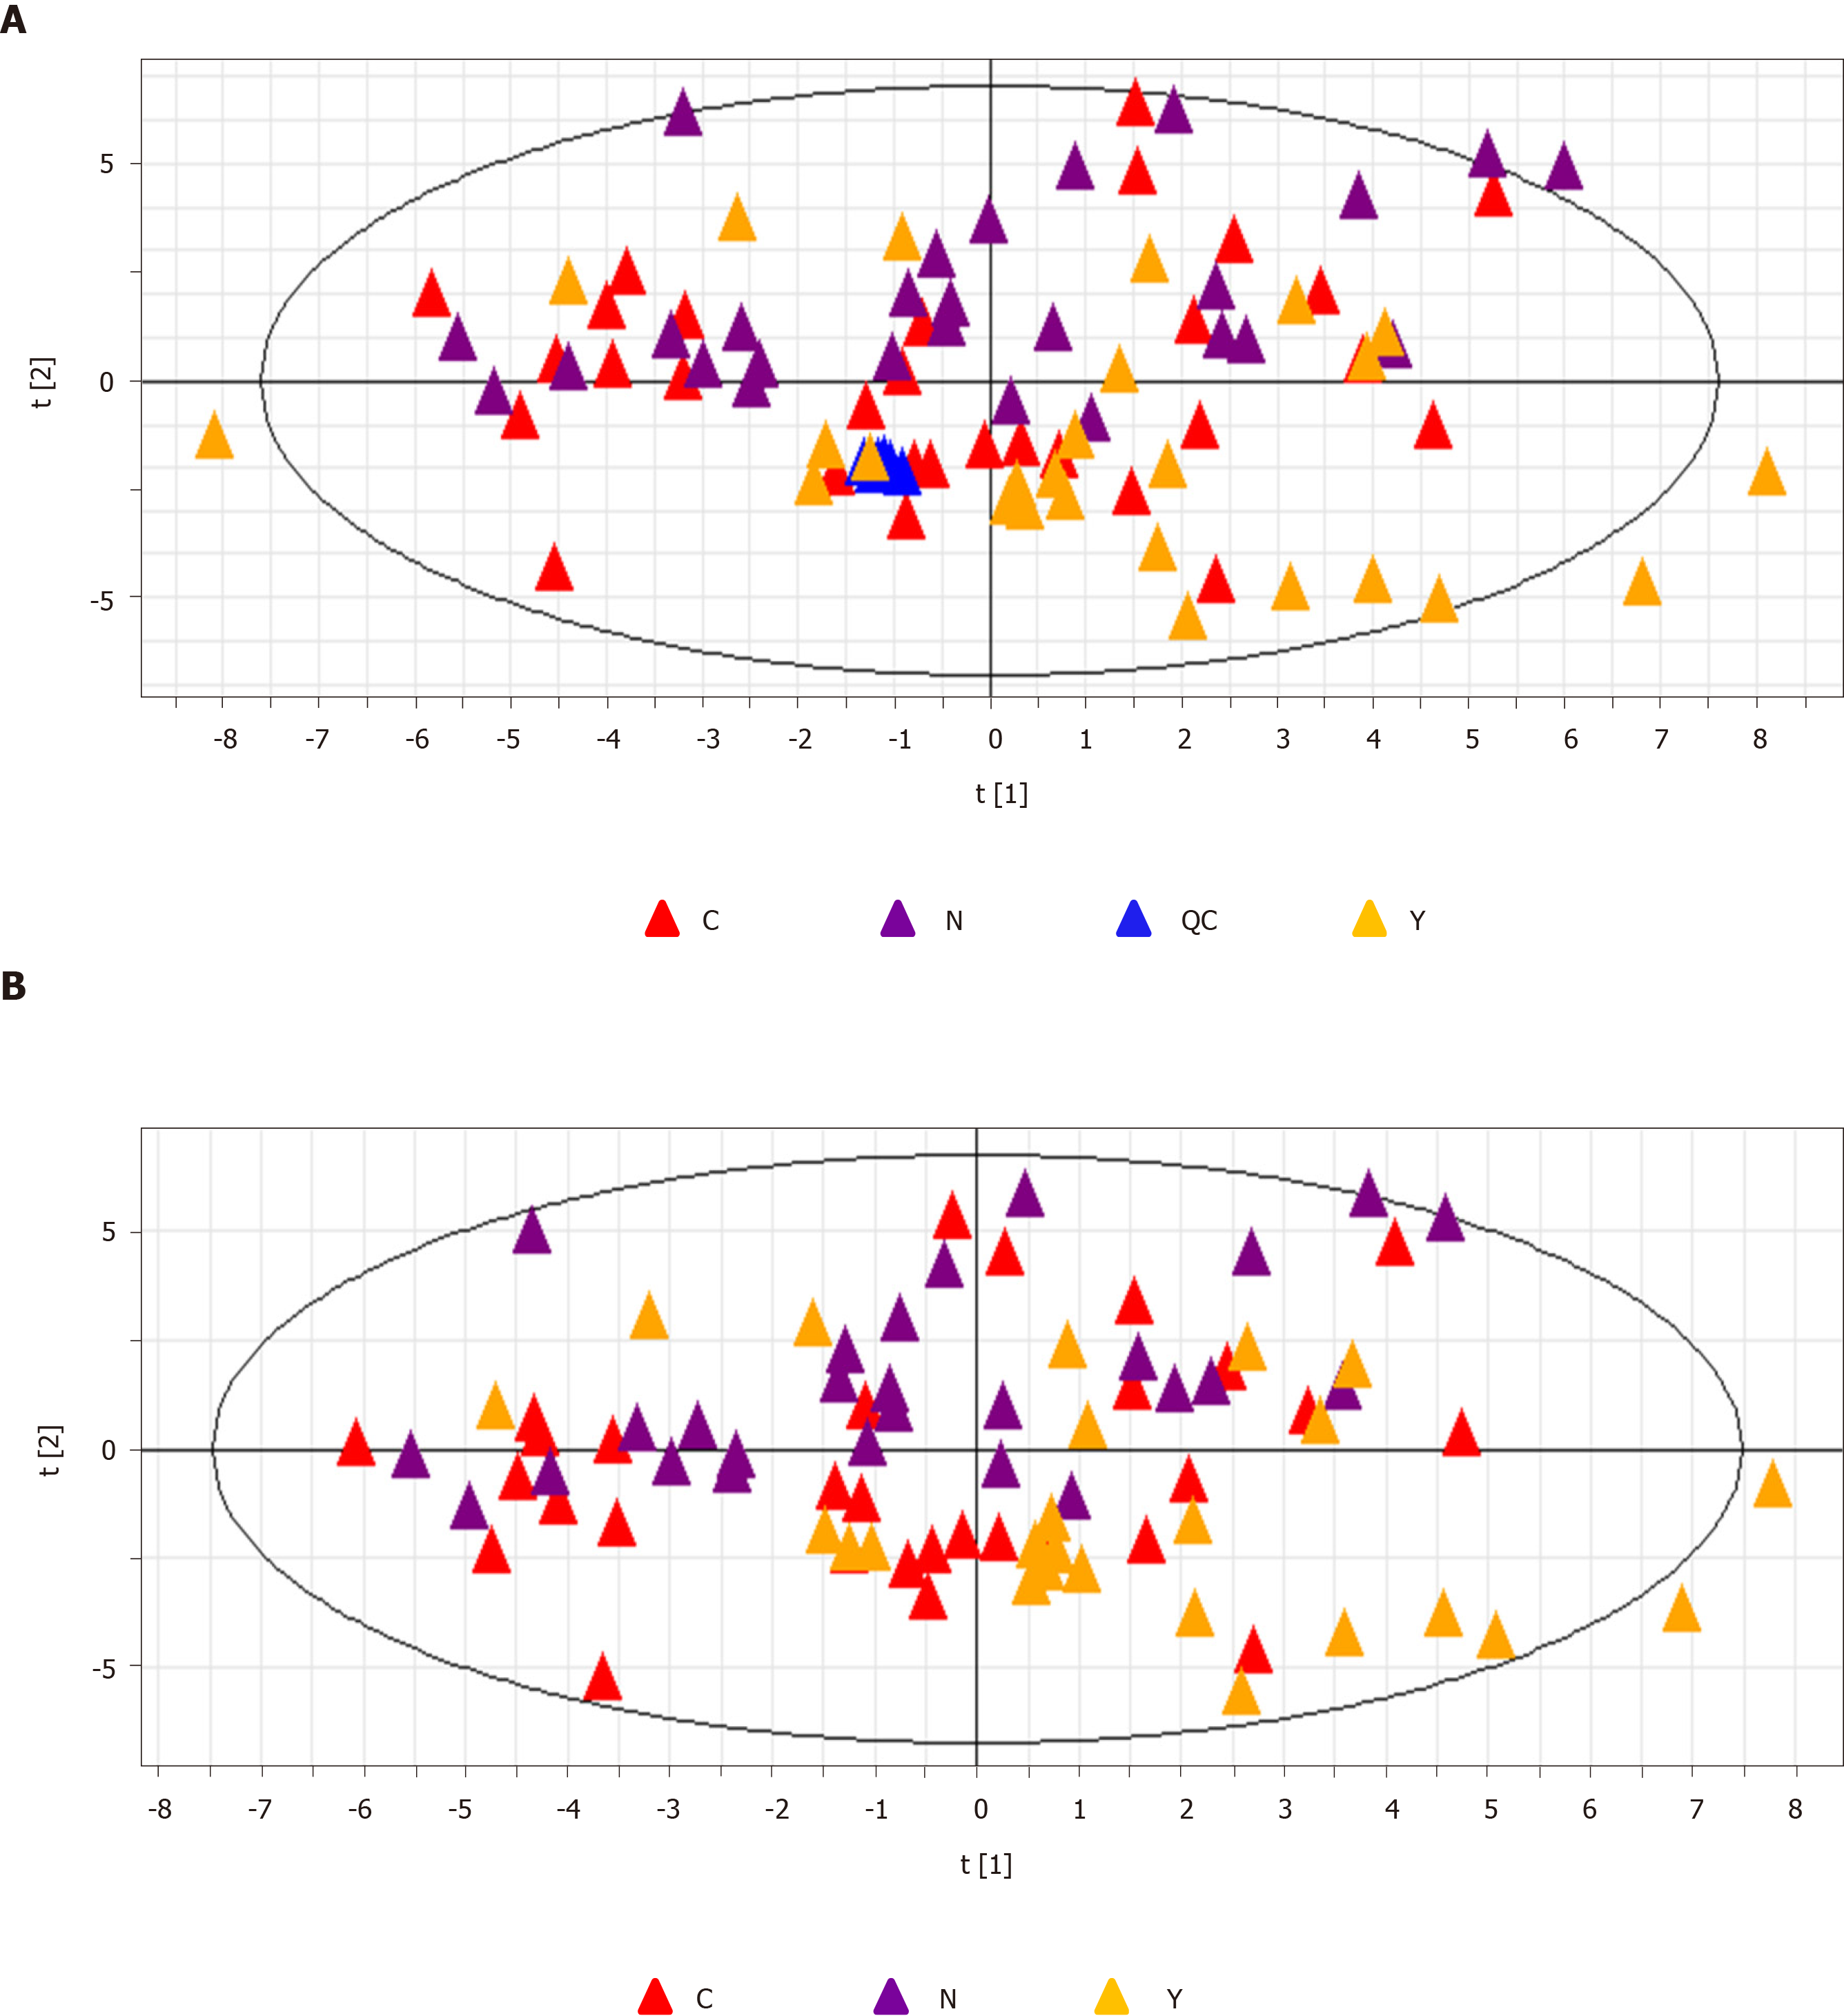
Figure 2 Principal component analysis.
A: The principal component analysis score plot of all samples including quality control samples. R2X = 0.134 cum, Q2 = 0.106 cum; and B: The principal component analysis score plot of all three groups, hepatocellular carcinoma group (C group) cirrhosis group (Y group), and healthy controls (N group). R2X = 0.139 cum, Q2 = 0.103 cum. QC: Quality control; PCA: Principal component analysis; HCC: Hepatocellular carcinoma.
- Citation: Zhou PC, Sun LQ, Shao L, Yi LZ, Li N, Fan XG. Establishment of a pattern recognition metabolomics model for the diagnosis of hepatocellular carcinoma. World J Gastroenterol 2020; 26(31): 4607-4623
- URL: https://www.wjgnet.com/1007-9327/full/v26/i31/4607.htm
- DOI: https://dx.doi.org/10.3748/wjg.v26.i31.4607


