Copyright
©The Author(s) 2020.
World J Gastroenterol. Aug 21, 2020; 26(31): 4607-4623
Published online Aug 21, 2020. doi: 10.3748/wjg.v26.i31.4607
Published online Aug 21, 2020. doi: 10.3748/wjg.v26.i31.4607
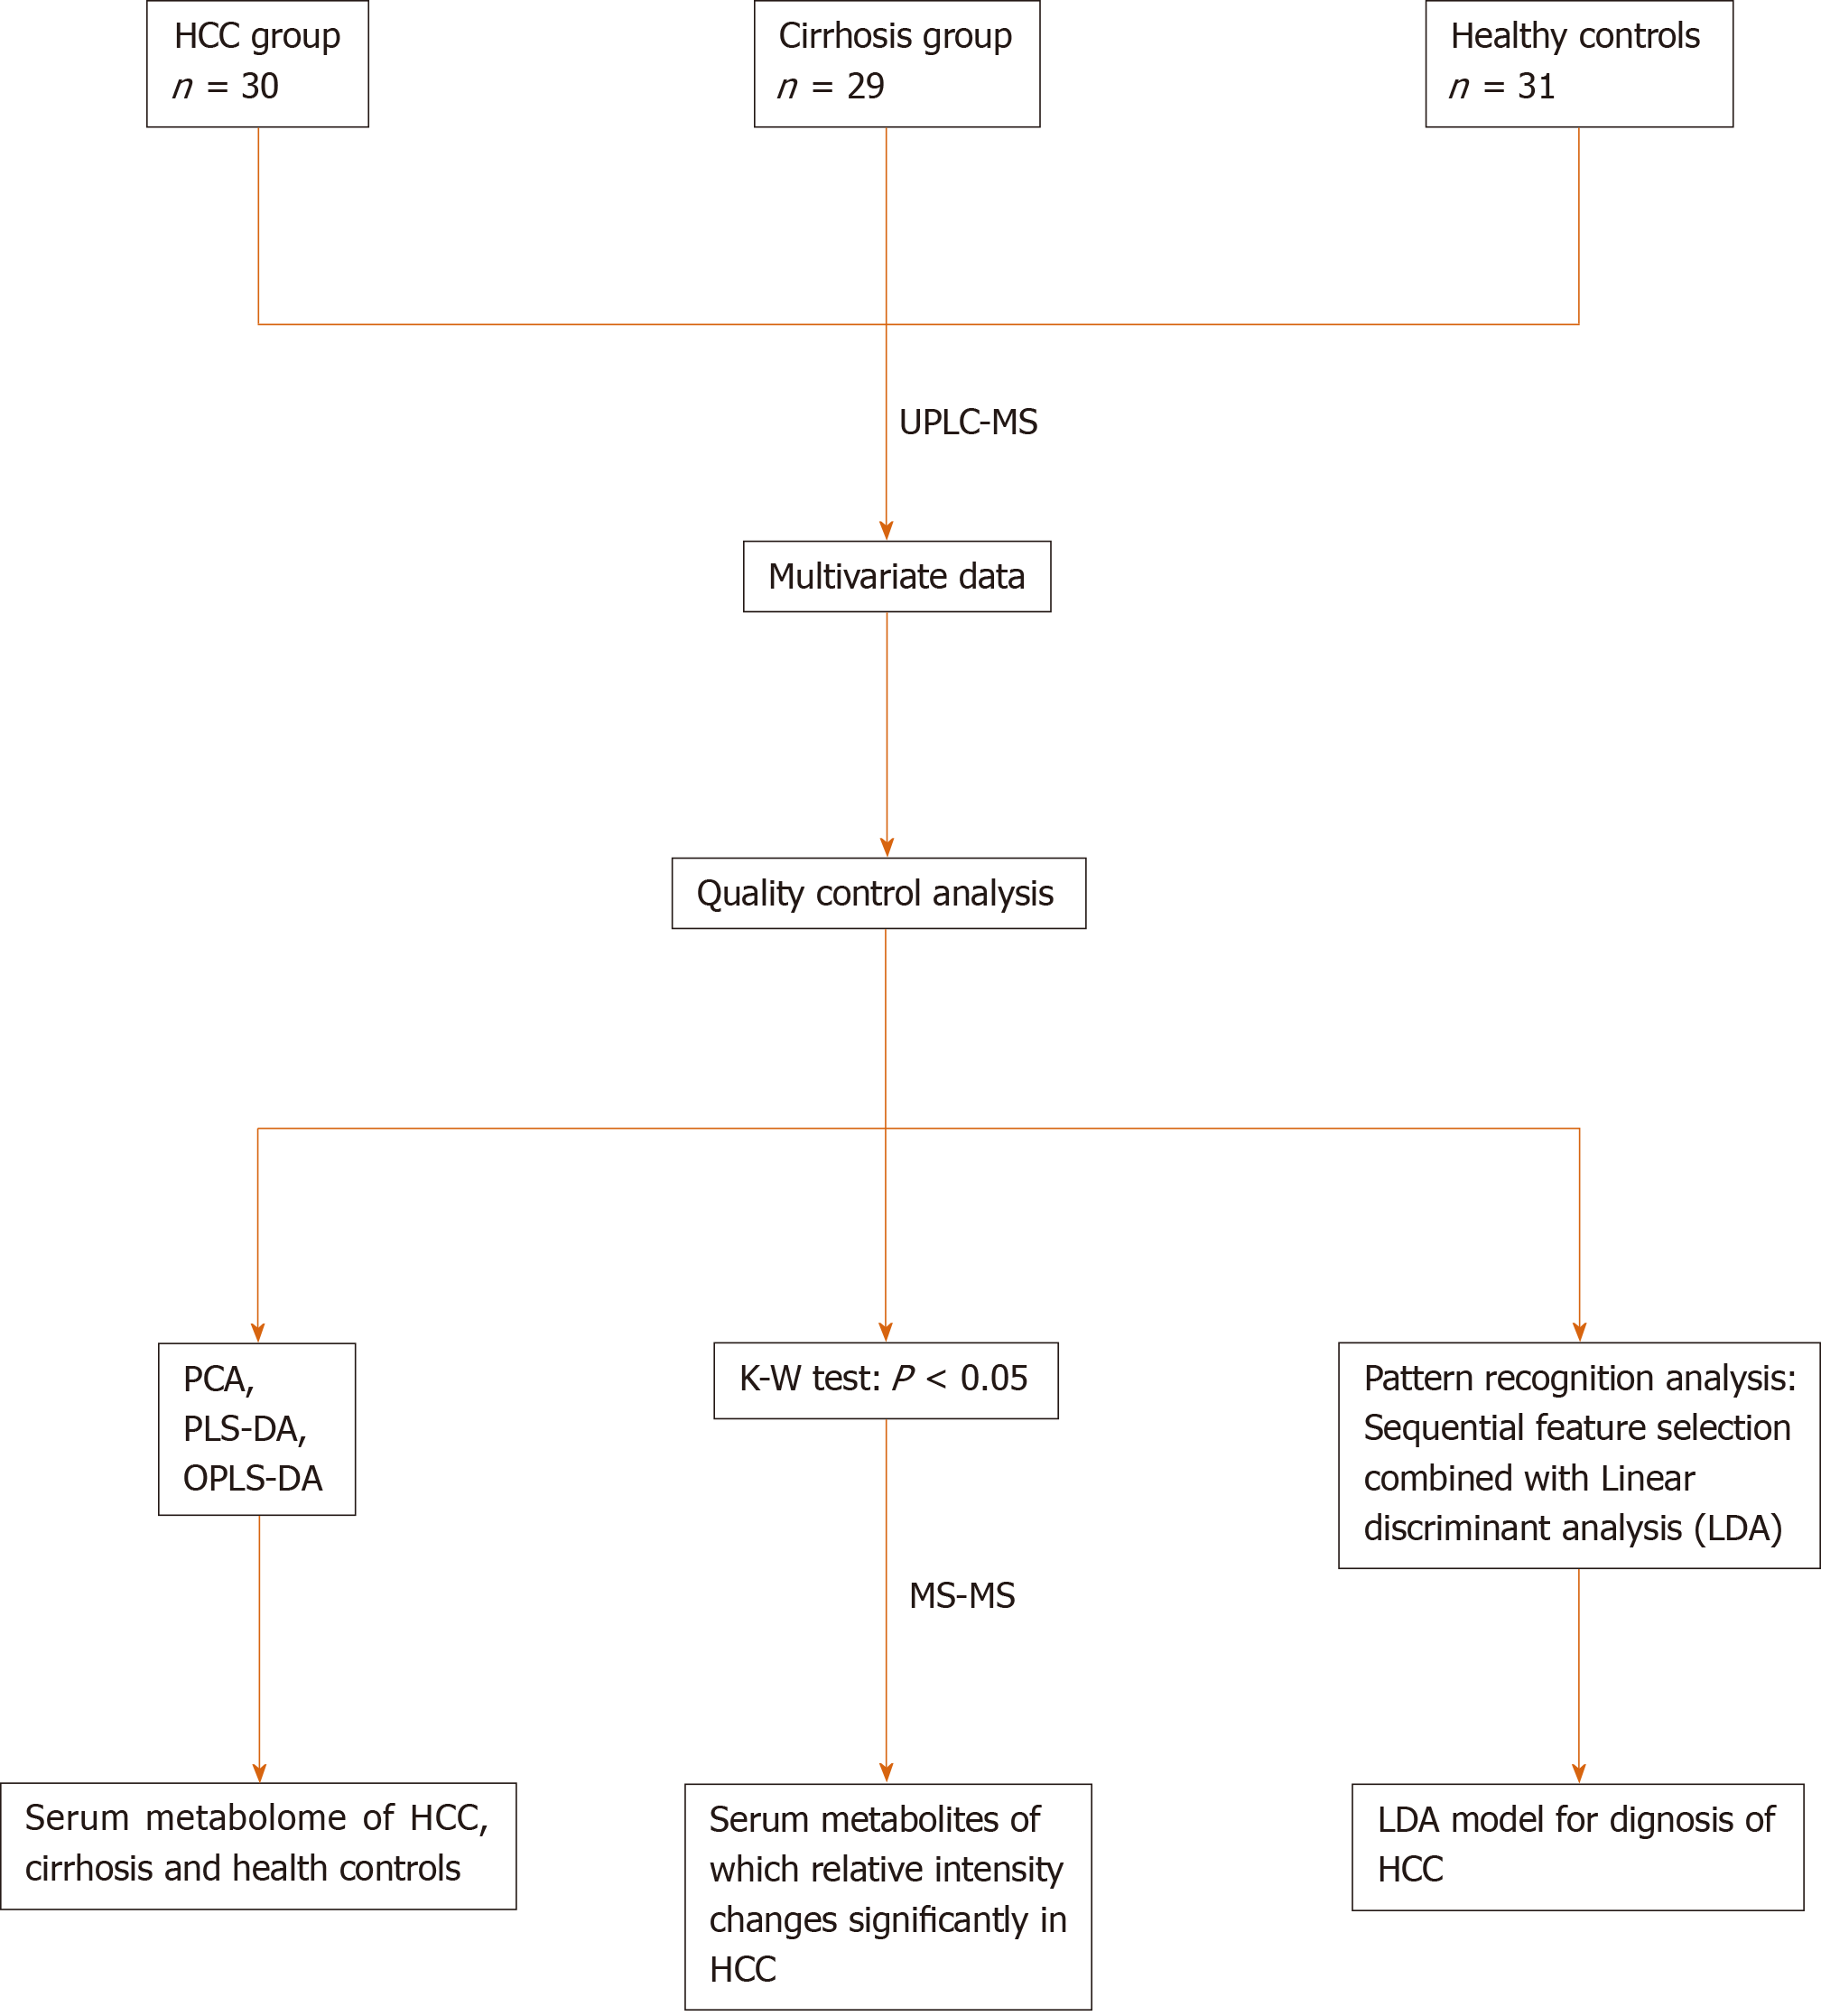
Figure 1 Road map of data analysis.
Road map of data analysis. Ordinary multivariate statistical analysis (principal component analysis, partial least squares discriminant analysis, and orthogonal partial least squares discriminant analysis) were used to describe the metabolome of the three groups. Pattern recognition analysis based on sequential feature selection combined with linear discriminant analysis were used to diagnose hepatocellular carcinoma. The Kruskal–Wallis test was used to identify differences in metabolites. PCA: Principal component analysis; PLS-DA: Partial least squares discriminant analysis; OPLS-DA: Orthogonal partial least squares discriminant analysis; LDA: Linear discriminant analysis; HCC: Hepatocellular carcinoma.
- Citation: Zhou PC, Sun LQ, Shao L, Yi LZ, Li N, Fan XG. Establishment of a pattern recognition metabolomics model for the diagnosis of hepatocellular carcinoma. World J Gastroenterol 2020; 26(31): 4607-4623
- URL: https://www.wjgnet.com/1007-9327/full/v26/i31/4607.htm
- DOI: https://dx.doi.org/10.3748/wjg.v26.i31.4607


