Copyright
©The Author(s) 2020.
World J Gastroenterol. Jan 21, 2020; 26(3): 335-352
Published online Jan 21, 2020. doi: 10.3748/wjg.v26.i3.335
Published online Jan 21, 2020. doi: 10.3748/wjg.v26.i3.335
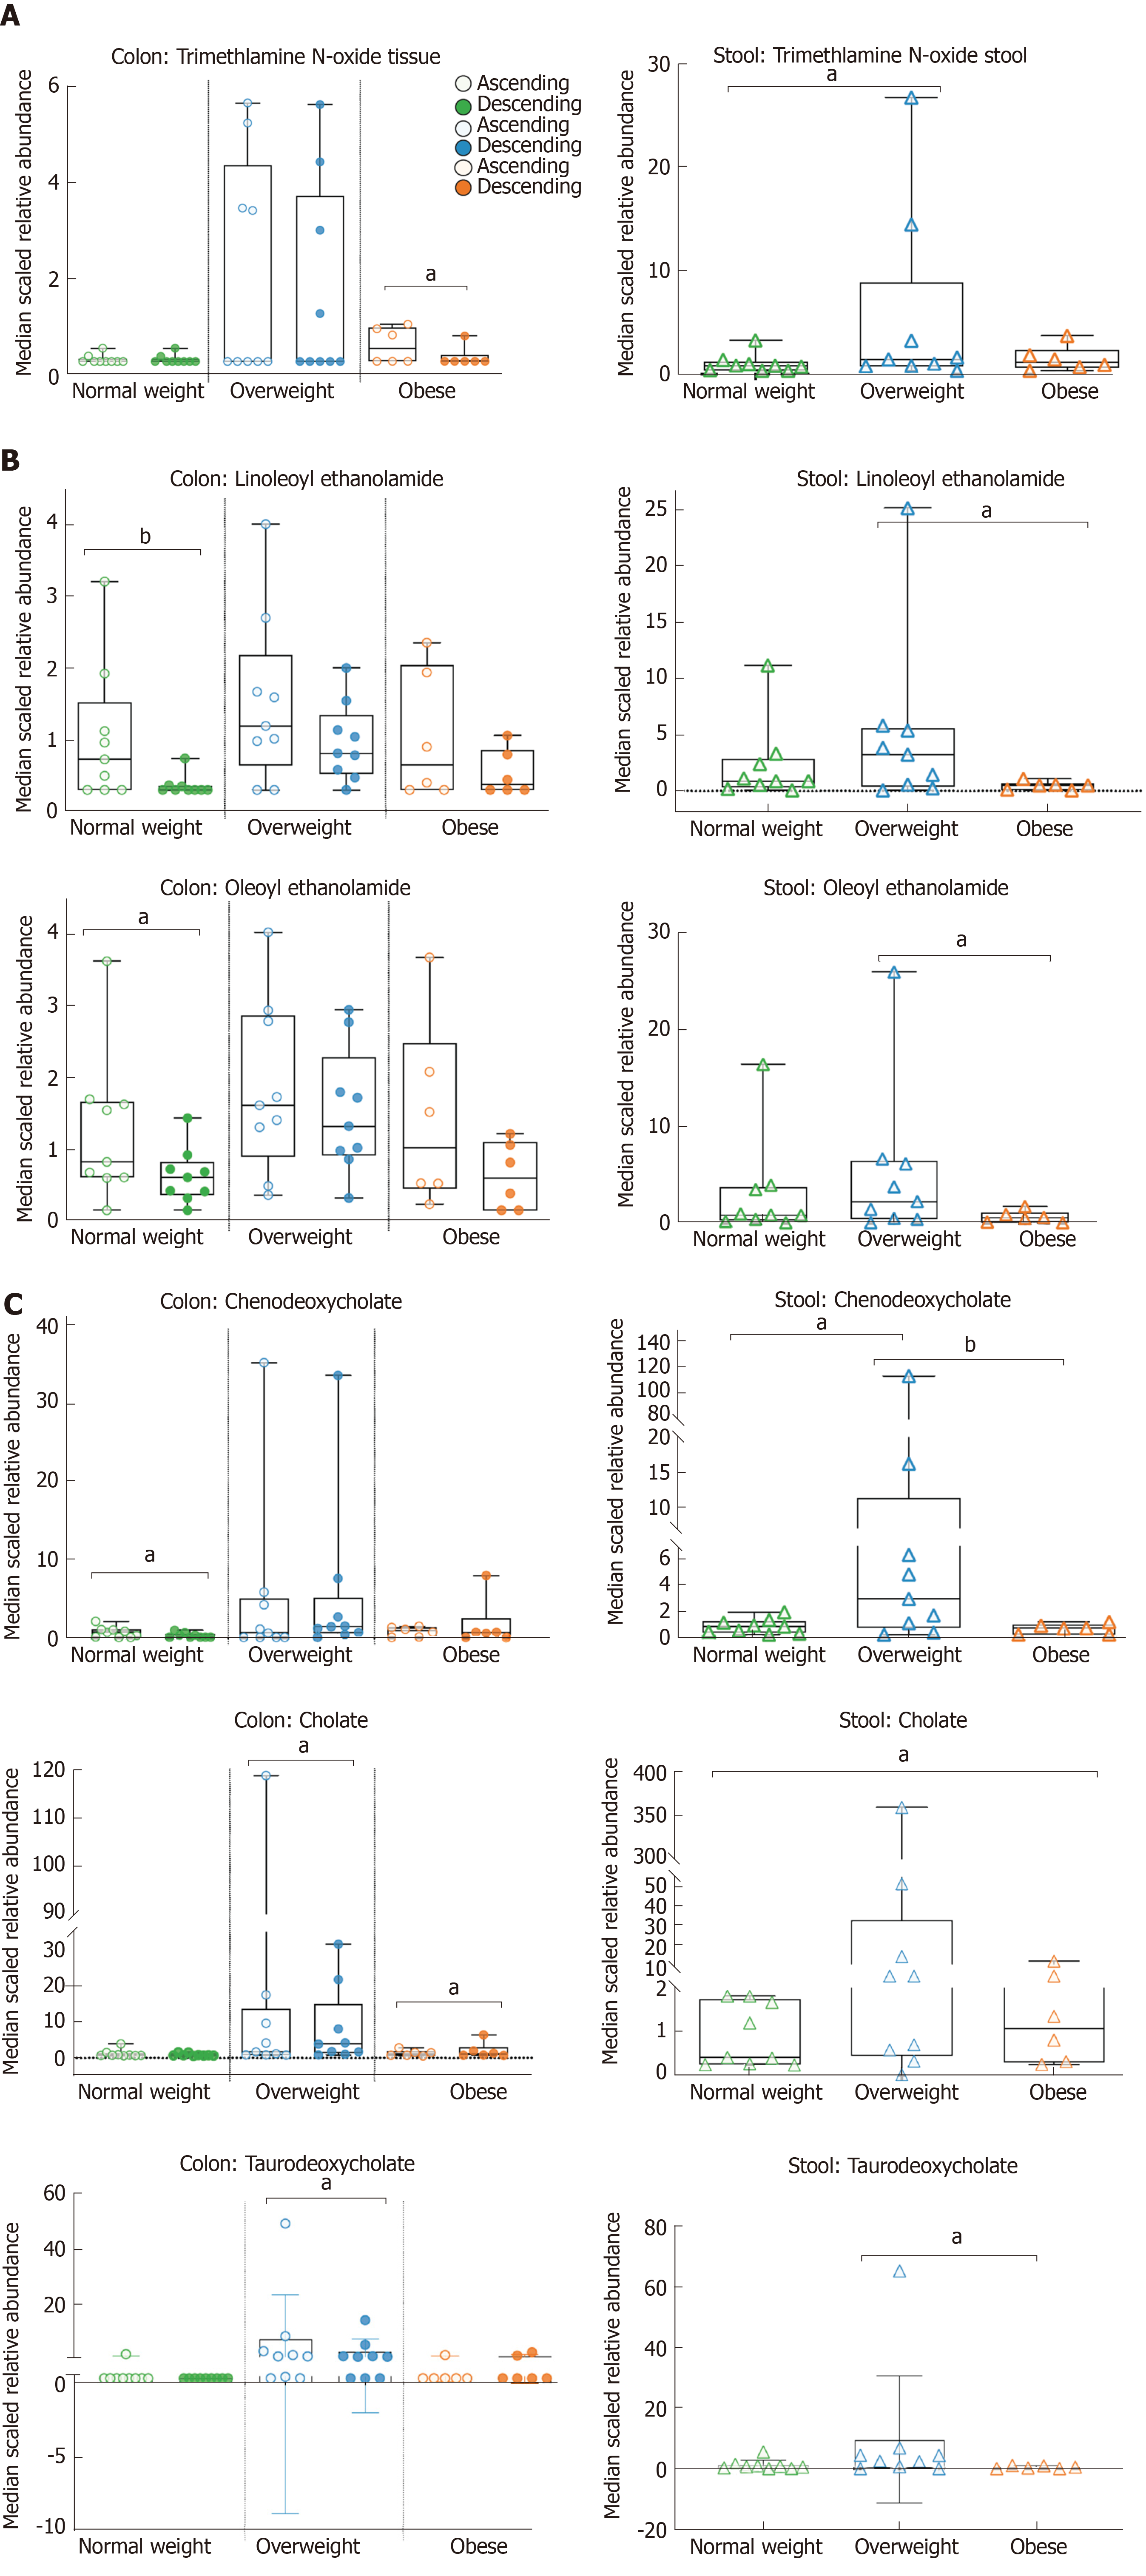
Figure 2 Fold-differences of colon and stool metabolites according to body mass index.
Metabolites were A: Phospholipid; Trimethylamine N-oxide; B: Endocannabinoids; linoleoyl ethanolamide, and oleoyl ethanolamide; C: Primary and secondary bile acids; chenodeoxycholate, cholate, and taurodeoxycholate. Left side panel colon, right side panel stool. Open circles represent ascending colon, closed circles represent descending colon, triangles represent stool (aP < 0.05, bP < 0.01).
- Citation: Baxter BA, Parker KD, Nosler MJ, Rao S, Craig R, Seiler C, Ryan EP. Metabolite profile comparisons between ascending and descending colon tissue in healthy adults. World J Gastroenterol 2020; 26(3): 335-352
- URL: https://www.wjgnet.com/1007-9327/full/v26/i3/335.htm
- DOI: https://dx.doi.org/10.3748/wjg.v26.i3.335


