Copyright
©The Author(s) 2020.
World J Gastroenterol. Aug 7, 2020; 26(29): 4272-4287
Published online Aug 7, 2020. doi: 10.3748/wjg.v26.i29.4272
Published online Aug 7, 2020. doi: 10.3748/wjg.v26.i29.4272
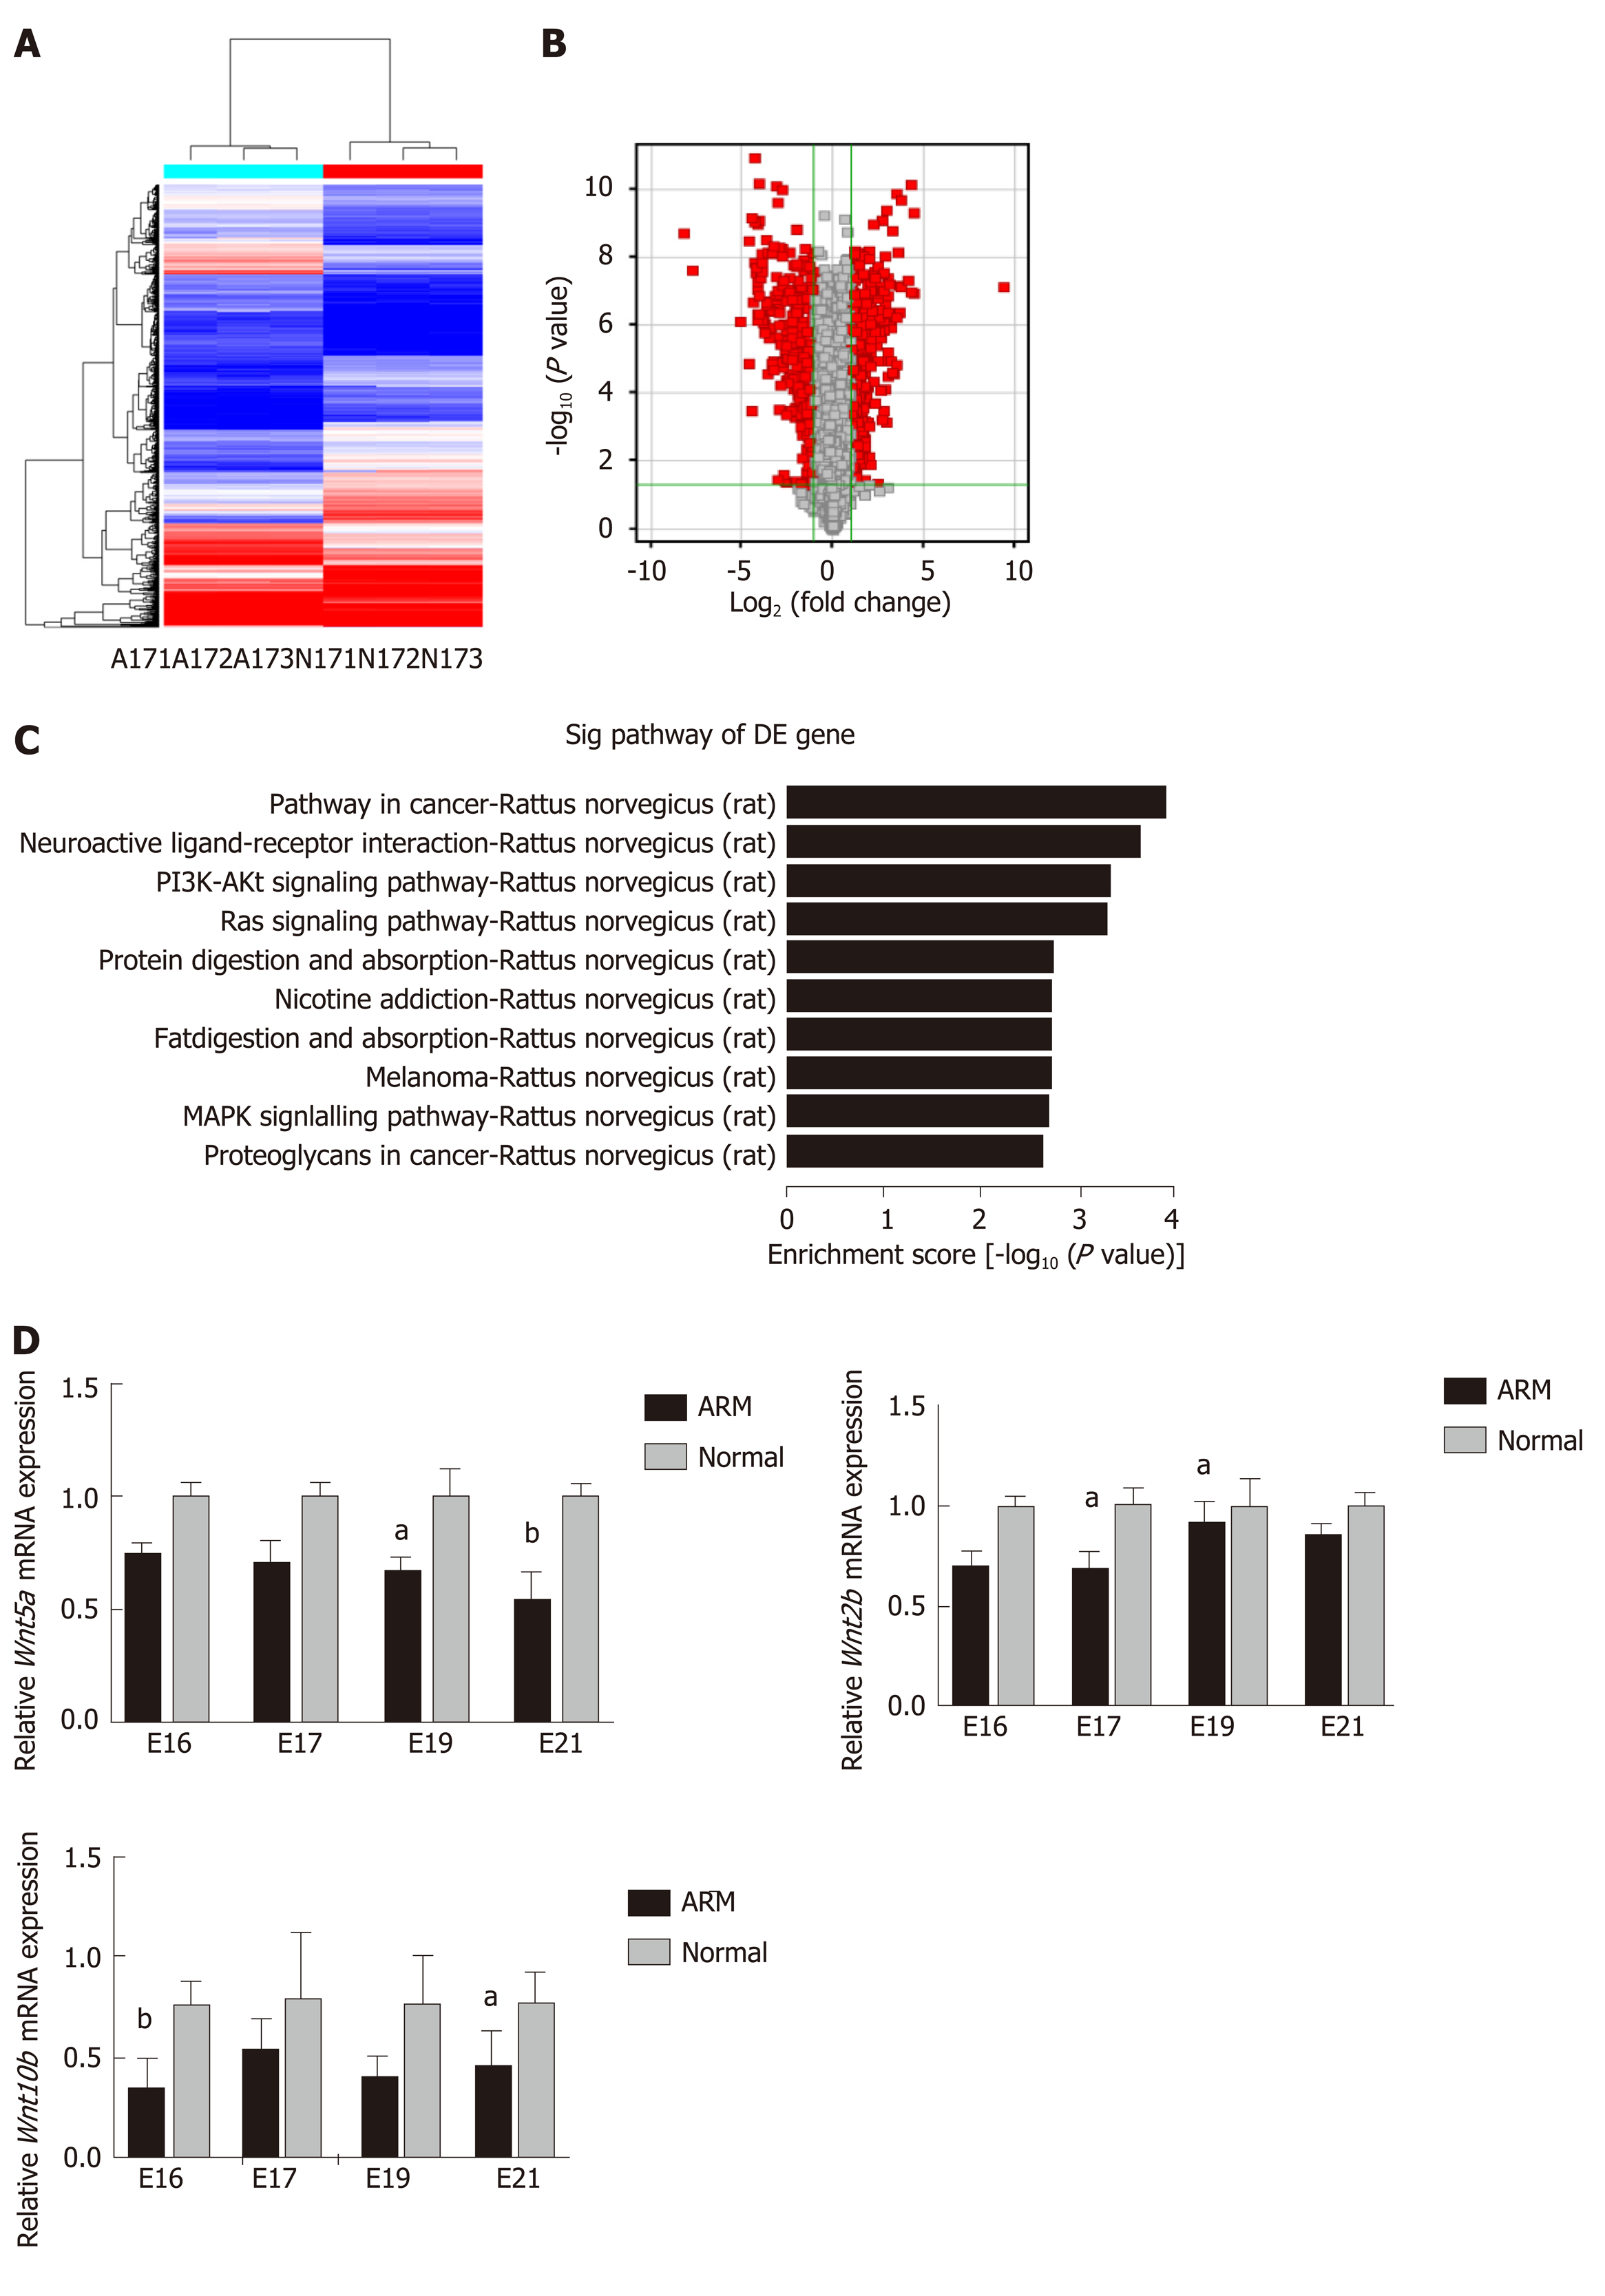
Figure 3 Identification of mRNAs in ARM and normal anorectal tissues.
A: Cluster analysis of differentially expressed mRNAs was conducted with a heatmap on E17. In the heatmap, red and blue indicate high and low expression, respectively. The color ranges from red to blue, indicating that log10 (transcripts per million + 1) expression ranges from large to small; B: Volcano plot showing 301 up-regulated (red) and 256 down-regulated (green) circular RNAs profiled on E17 in anorectal malformations (ARM) anorectal tissues compared to normal tissues showing a two-fold change (P < 0.05); C: Pathway analysis was performed using Kyoto Encyclopedia of Genes and Genomes pathways. The top 10 pathways in mRNA analysis are shown; D: Three mRNAs were evaluated by quantitative reverse transcription polymerase chain reaction in ARM and normal anorectal tissues. aP < 0.05 vs normal, bP < 0.01 vs normal. A: Anorectal malformations; ARM: Anorectal malformations; E: Embryonic day; N: Normal; DE: Differentially expression.
- Citation: Liu D, Qu Y, Cao ZN, Jia HM. Rno_circ_0005139 regulates apoptosis by targeting Wnt5a in rat anorectal malformations. World J Gastroenterol 2020; 26(29): 4272-4287
- URL: https://www.wjgnet.com/1007-9327/full/v26/i29/4272.htm
- DOI: https://dx.doi.org/10.3748/wjg.v26.i29.4272


