Copyright
©The Author(s) 2020.
World J Gastroenterol. Jul 21, 2020; 26(27): 3975-3988
Published online Jul 21, 2020. doi: 10.3748/wjg.v26.i27.3975
Published online Jul 21, 2020. doi: 10.3748/wjg.v26.i27.3975
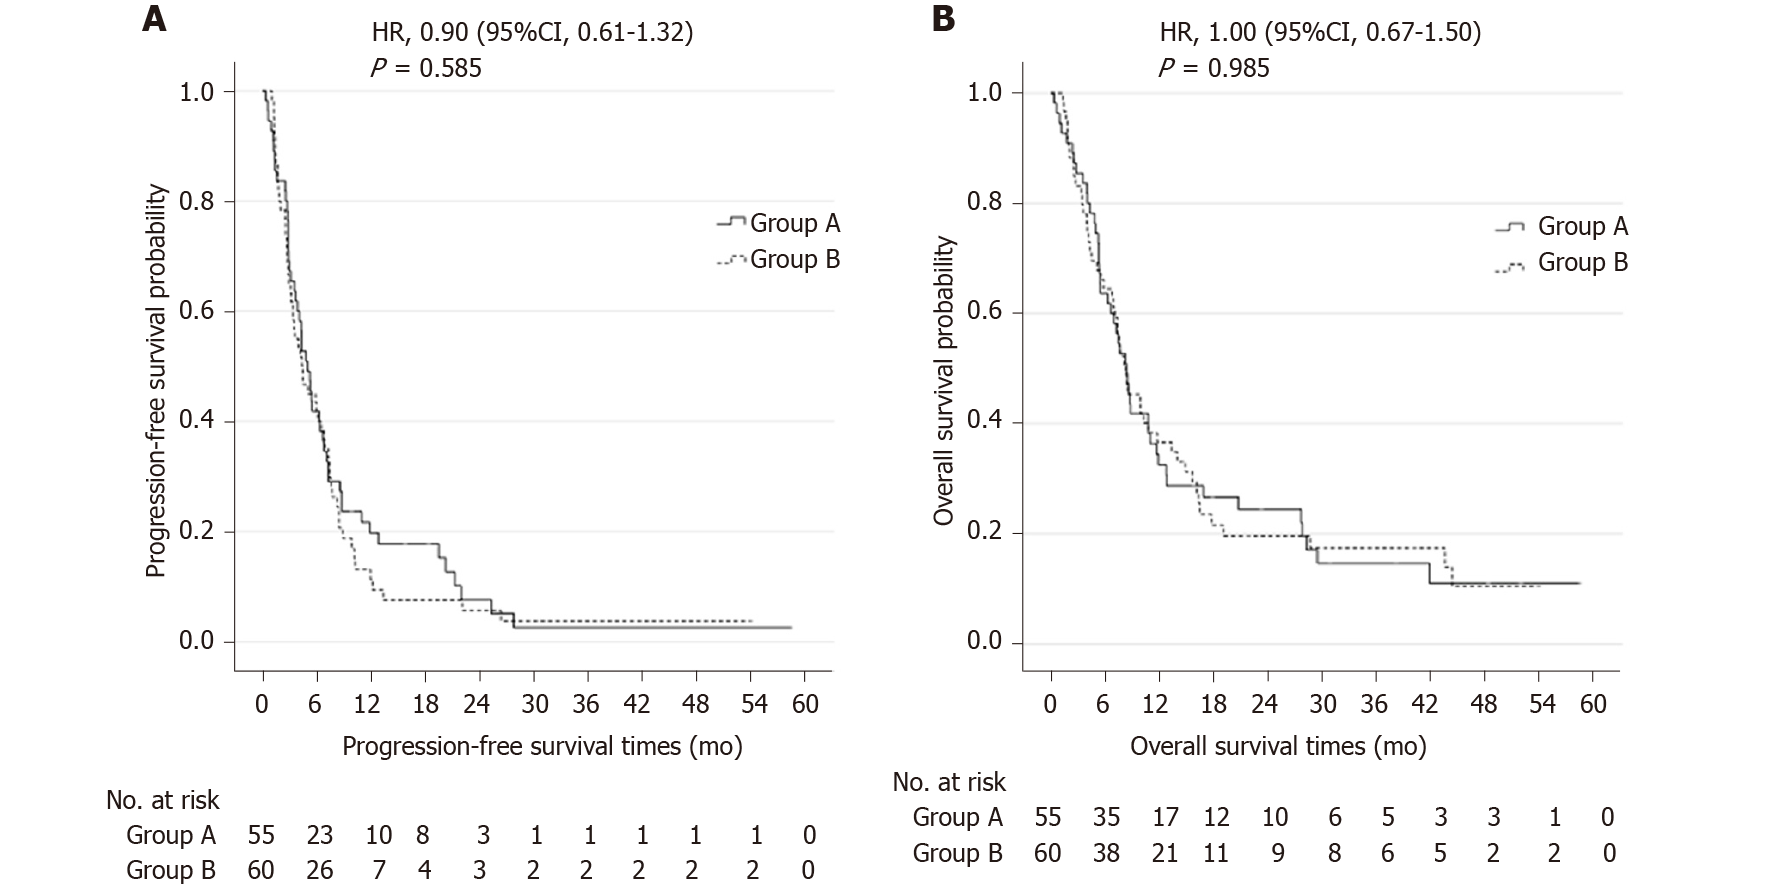
Figure 2 Kaplan-Meier curves.
A: Curves of progression-free survival; B: Curves of overall survival. Group A indicates hepatic arterial infusion chemotherapy after transarterial chemoembolization plus S-1. Group B indicates hepatic arterial infusion chemotherapy after transarterial chemoembolization. HR: Hazard ratio.
- Citation: Guo JH, Liu SX, Gao S, Kou FX, Zhang X, Wu D, Li XT, Chen H, Wang XD, Liu P, Zhang PJ, Xu HF, Cao G, Zhu LZ, Yang RJ, Zhu X. Transarterial chemoembolization with hepatic arterial infusion chemotherapy plus S-1 for hepatocellular carcinoma. World J Gastroenterol 2020; 26(27): 3975-3988
- URL: https://www.wjgnet.com/1007-9327/full/v26/i27/3975.htm
- DOI: https://dx.doi.org/10.3748/wjg.v26.i27.3975


