Copyright
©The Author(s) 2020.
World J Gastroenterol. Jun 14, 2020; 26(22): 3110-3117
Published online Jun 14, 2020. doi: 10.3748/wjg.v26.i22.3110
Published online Jun 14, 2020. doi: 10.3748/wjg.v26.i22.3110
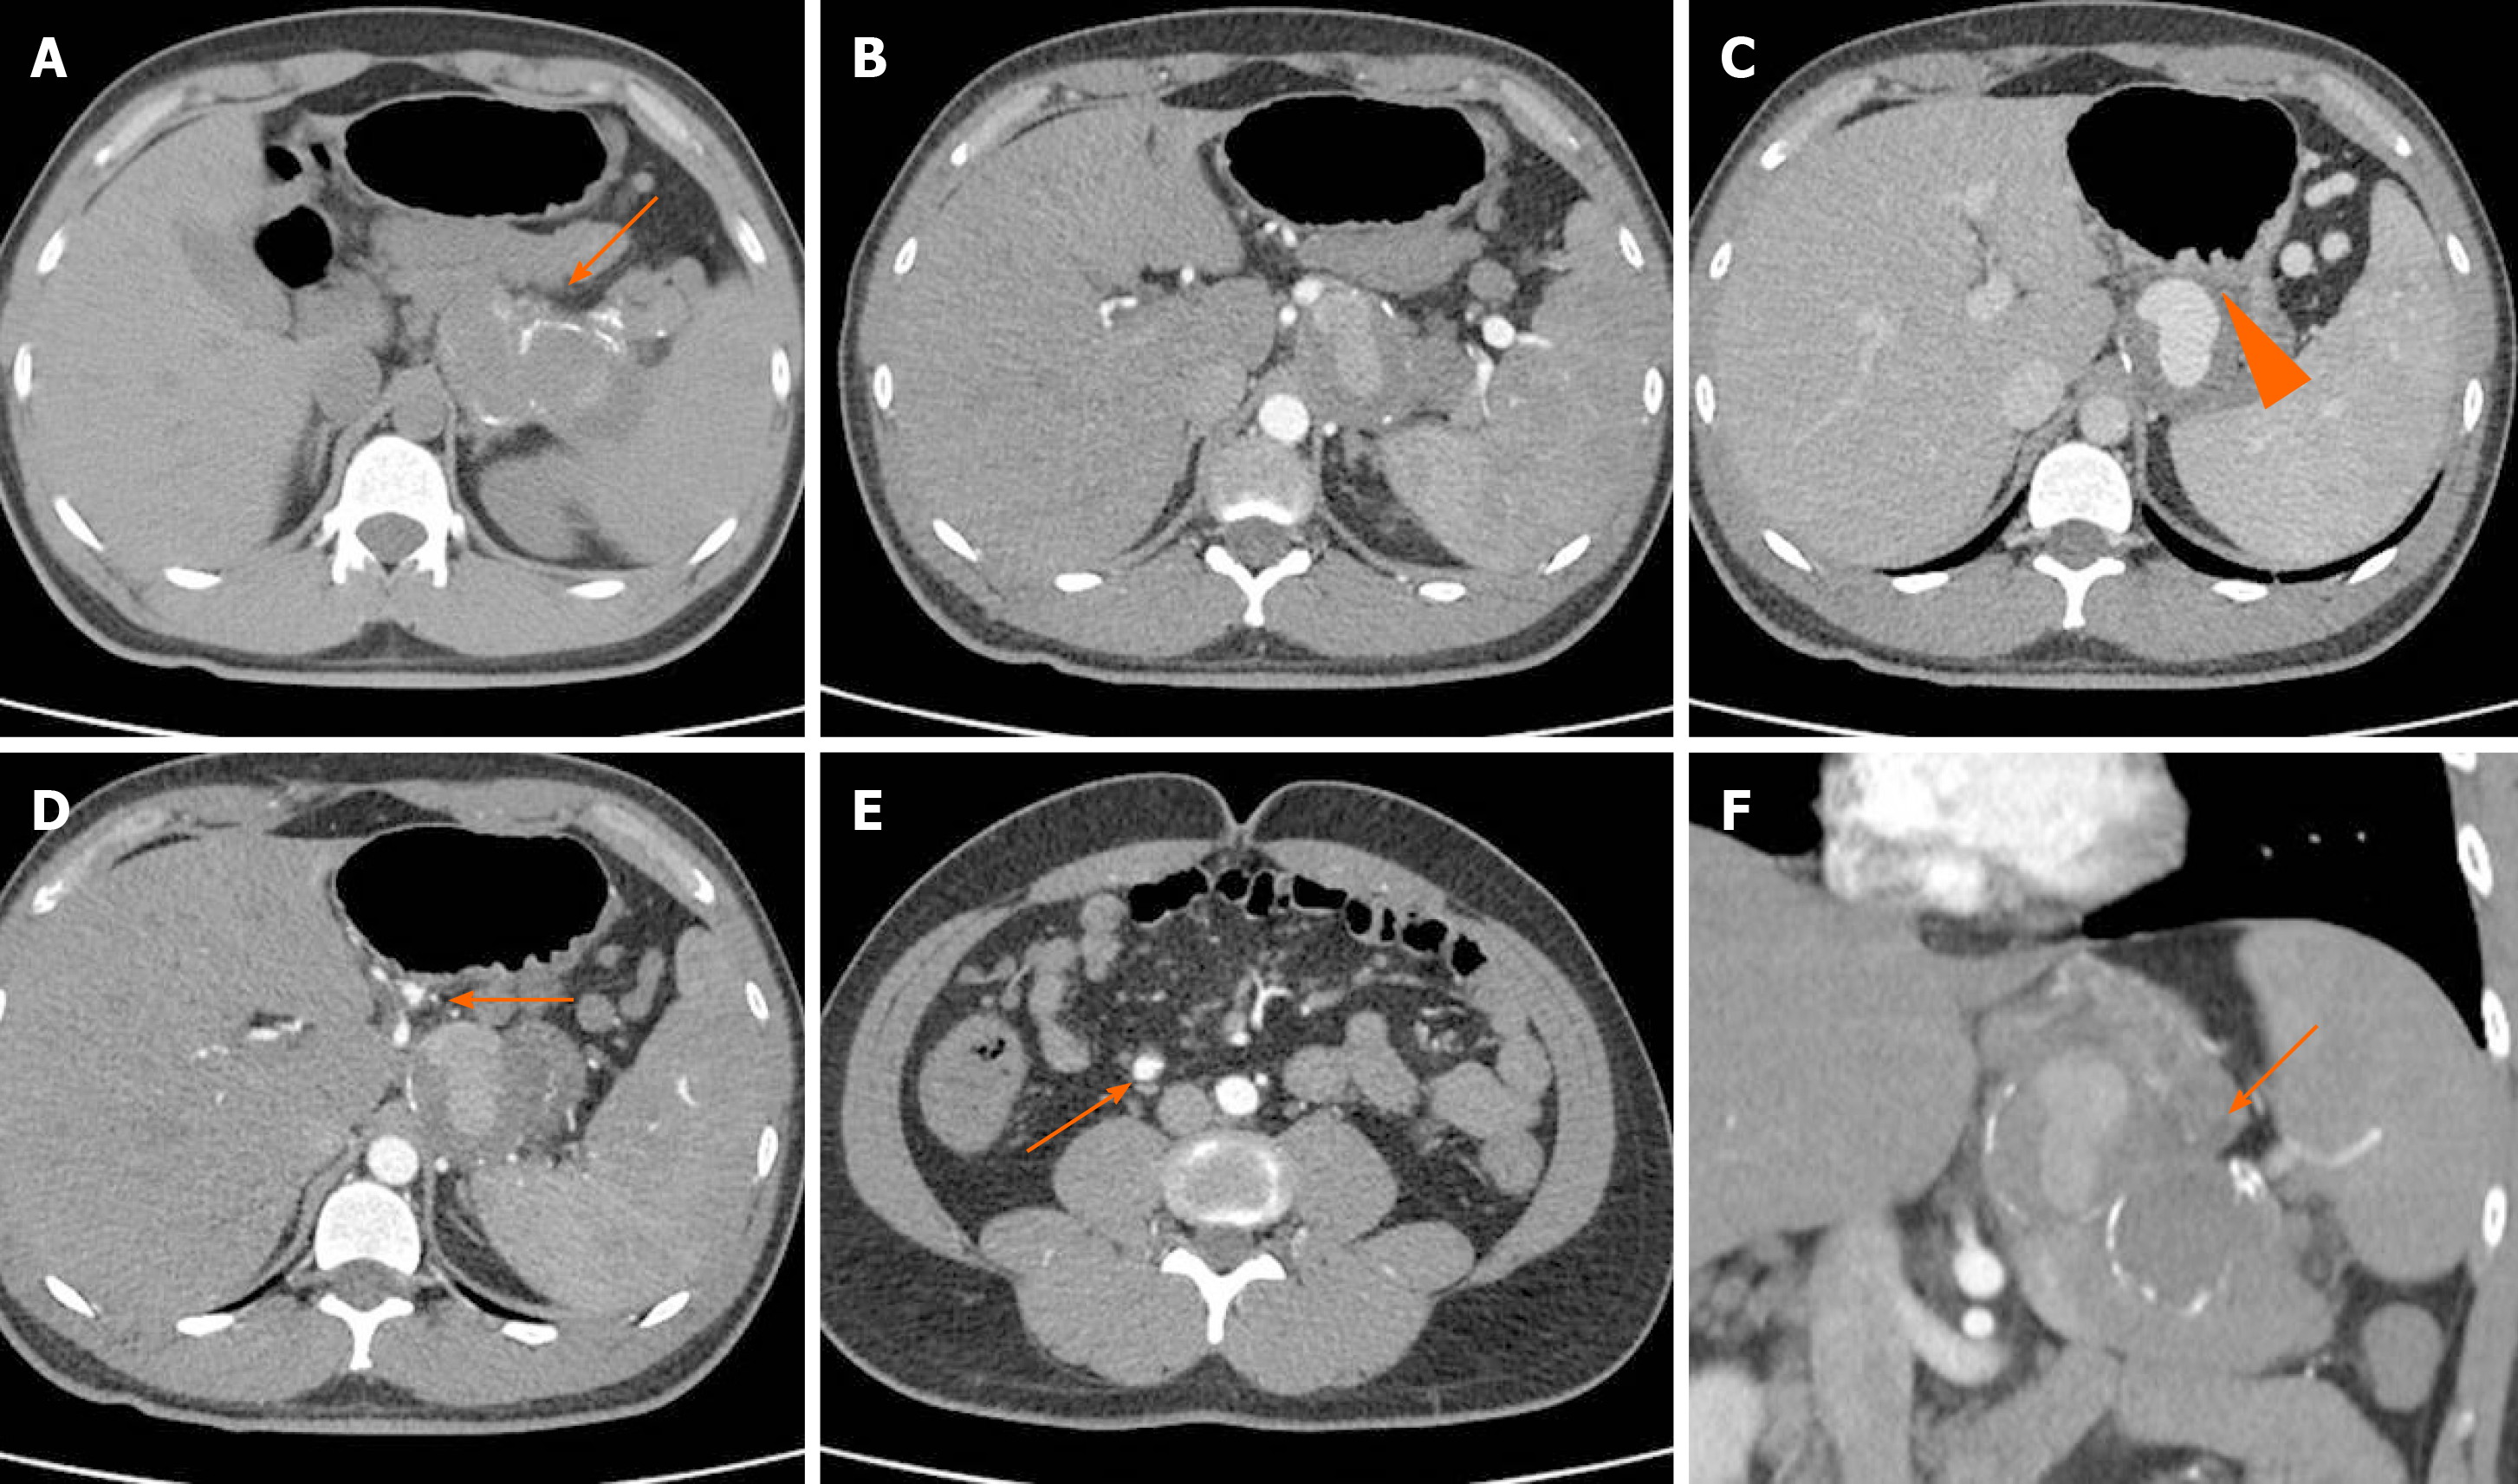
Figure 2 Computed tomography angiography.
A: Non contrast enhanced computed tomography (CT) shows a large mass, with partially calcified wall, adjacent to the spleen; B and C: The opacification of the aneurysm is partial and low, because of its large volume and low pressure; C: It is packed to the posterior wall of the stomach (arrow head); D and E: Two small aneurysms of the left gastric artery (D, arrow) and ileocolic artery (E, arrow) are also evident; F: After contrast injection, CT shows a splenic artery fully replaced by a giant aneurysm (10.5 cm in maximum diameter, panel f, coronal view), partially thrombosed.
- Citation: Panzera F, Inchingolo R, Rizzi M, Biscaglia A, Schievenin MG, Tallarico E, Pacifico G, Di Venere B. Giant splenic artery aneurysm presenting with massive upper gastrointestinal bleeding: A case report and review of literature. World J Gastroenterol 2020; 26(22): 3110-3117
- URL: https://www.wjgnet.com/1007-9327/full/v26/i22/3110.htm
- DOI: https://dx.doi.org/10.3748/wjg.v26.i22.3110


