Copyright
©The Author(s) 2020.
World J Gastroenterol. Jun 7, 2020; 26(21): 2691-2701
Published online Jun 7, 2020. doi: 10.3748/wjg.v26.i21.2691
Published online Jun 7, 2020. doi: 10.3748/wjg.v26.i21.2691
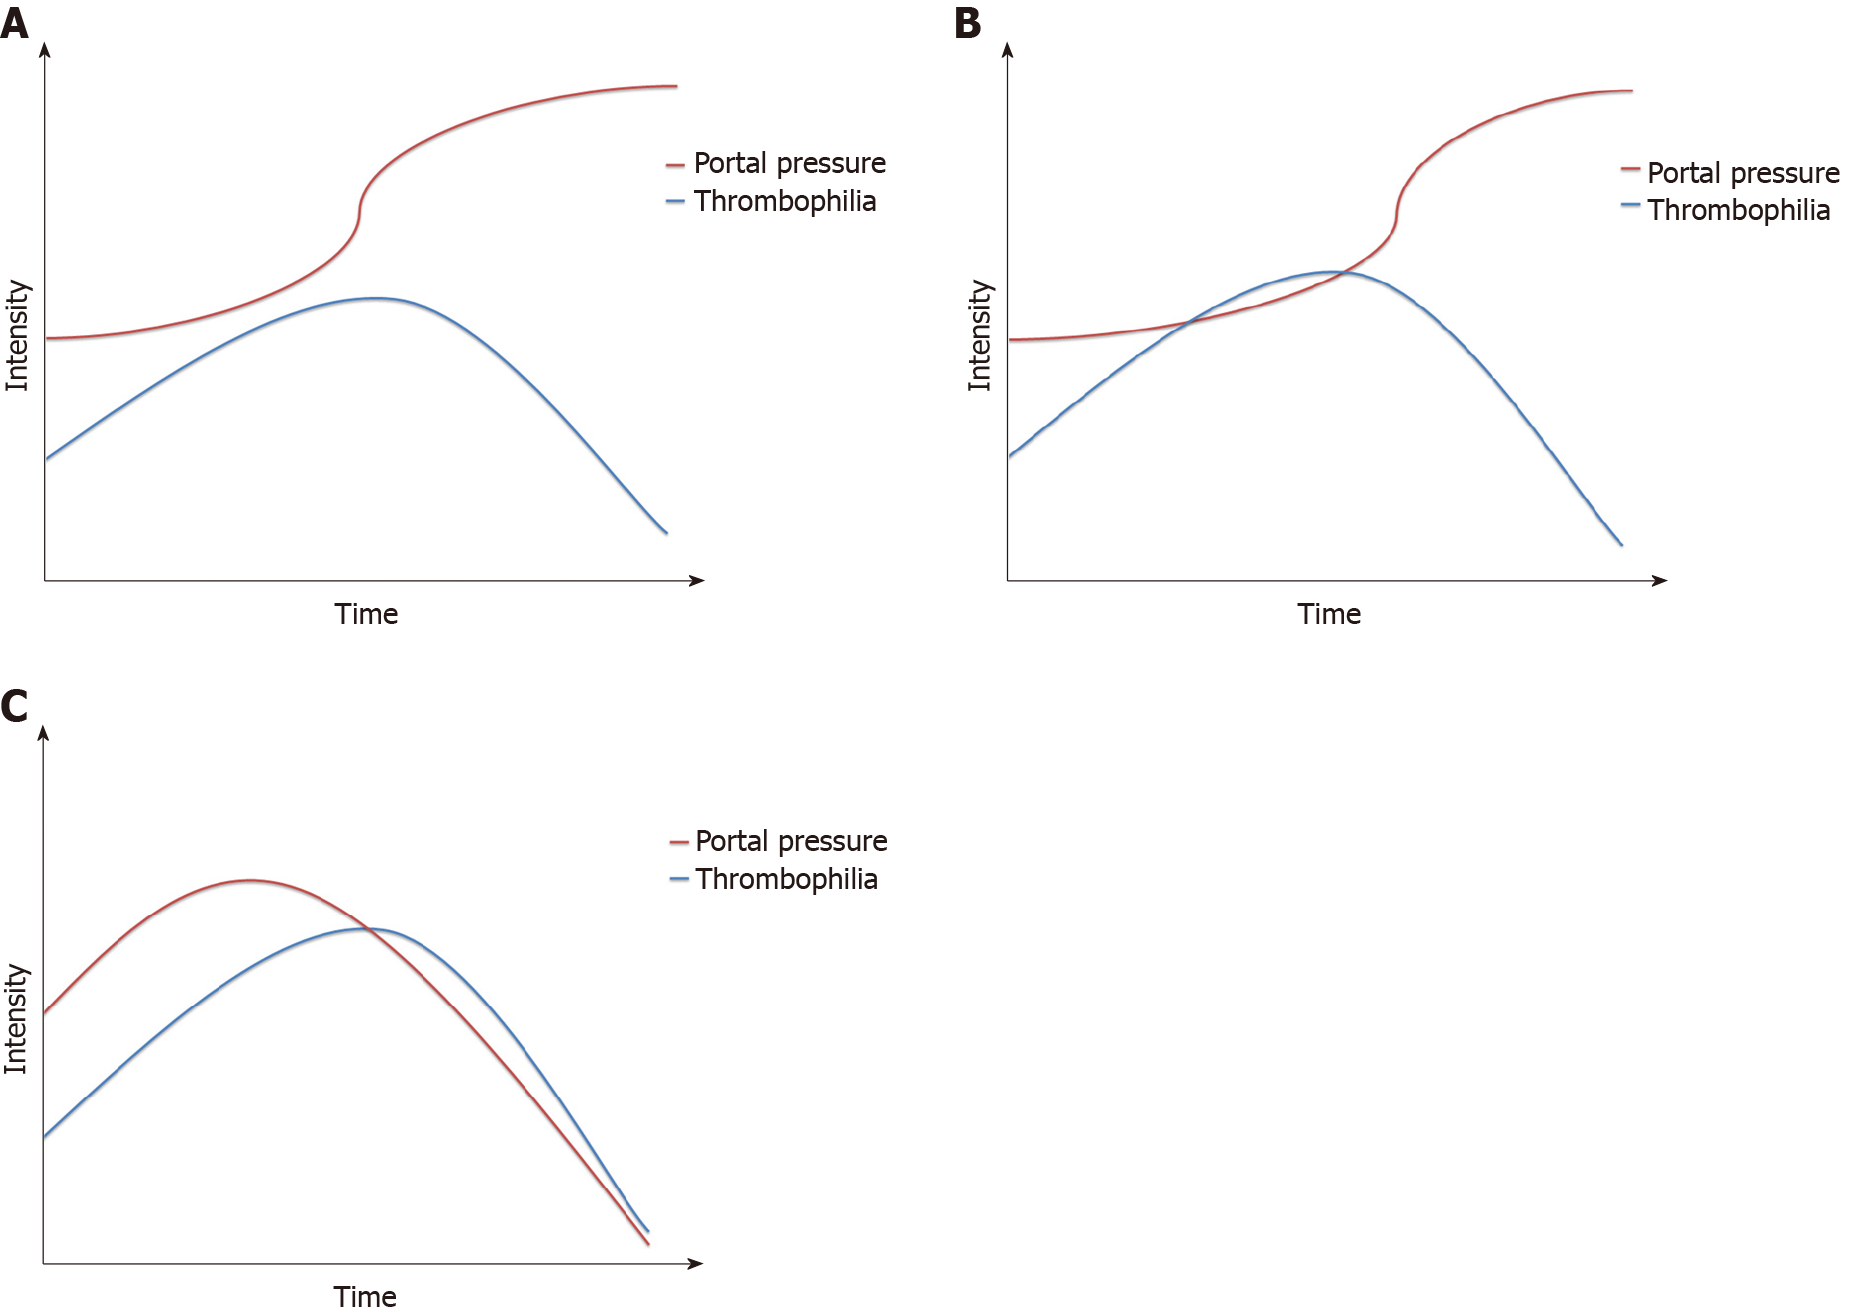
Figure 1 Relationship between portal pressure and thrombophilia in the natural course of portal vein thrombosis.
A: Portal pressure increases gradually, while the intensity of thrombophilia increases and then decreases. No crossover of the two curves means that portal vein thrombosis (PVT) never occurs; B: The two curves cross each other, but portal pressure continues to increase, and its curve is separate from the curve of thrombophilia; thus, PVT occurs but stabilizes or improves; C: Portal pressure increases at first and then decreases due to diversion of the blood flow by the collaterals. The two curves cross and remain close to each other, meaning that PVT occurs and worsens.
- Citation: Teng F, Sun KY, Fu ZR. Tailored classification of portal vein thrombosis for liver transplantation: Focus on strategies for portal vein inflow reconstruction. World J Gastroenterol 2020; 26(21): 2691-2701
- URL: https://www.wjgnet.com/1007-9327/full/v26/i21/2691.htm
- DOI: https://dx.doi.org/10.3748/wjg.v26.i21.2691


