Copyright
©The Author(s) 2020.
World J Gastroenterol. May 28, 2020; 26(20): 2599-2617
Published online May 28, 2020. doi: 10.3748/wjg.v26.i20.2599
Published online May 28, 2020. doi: 10.3748/wjg.v26.i20.2599
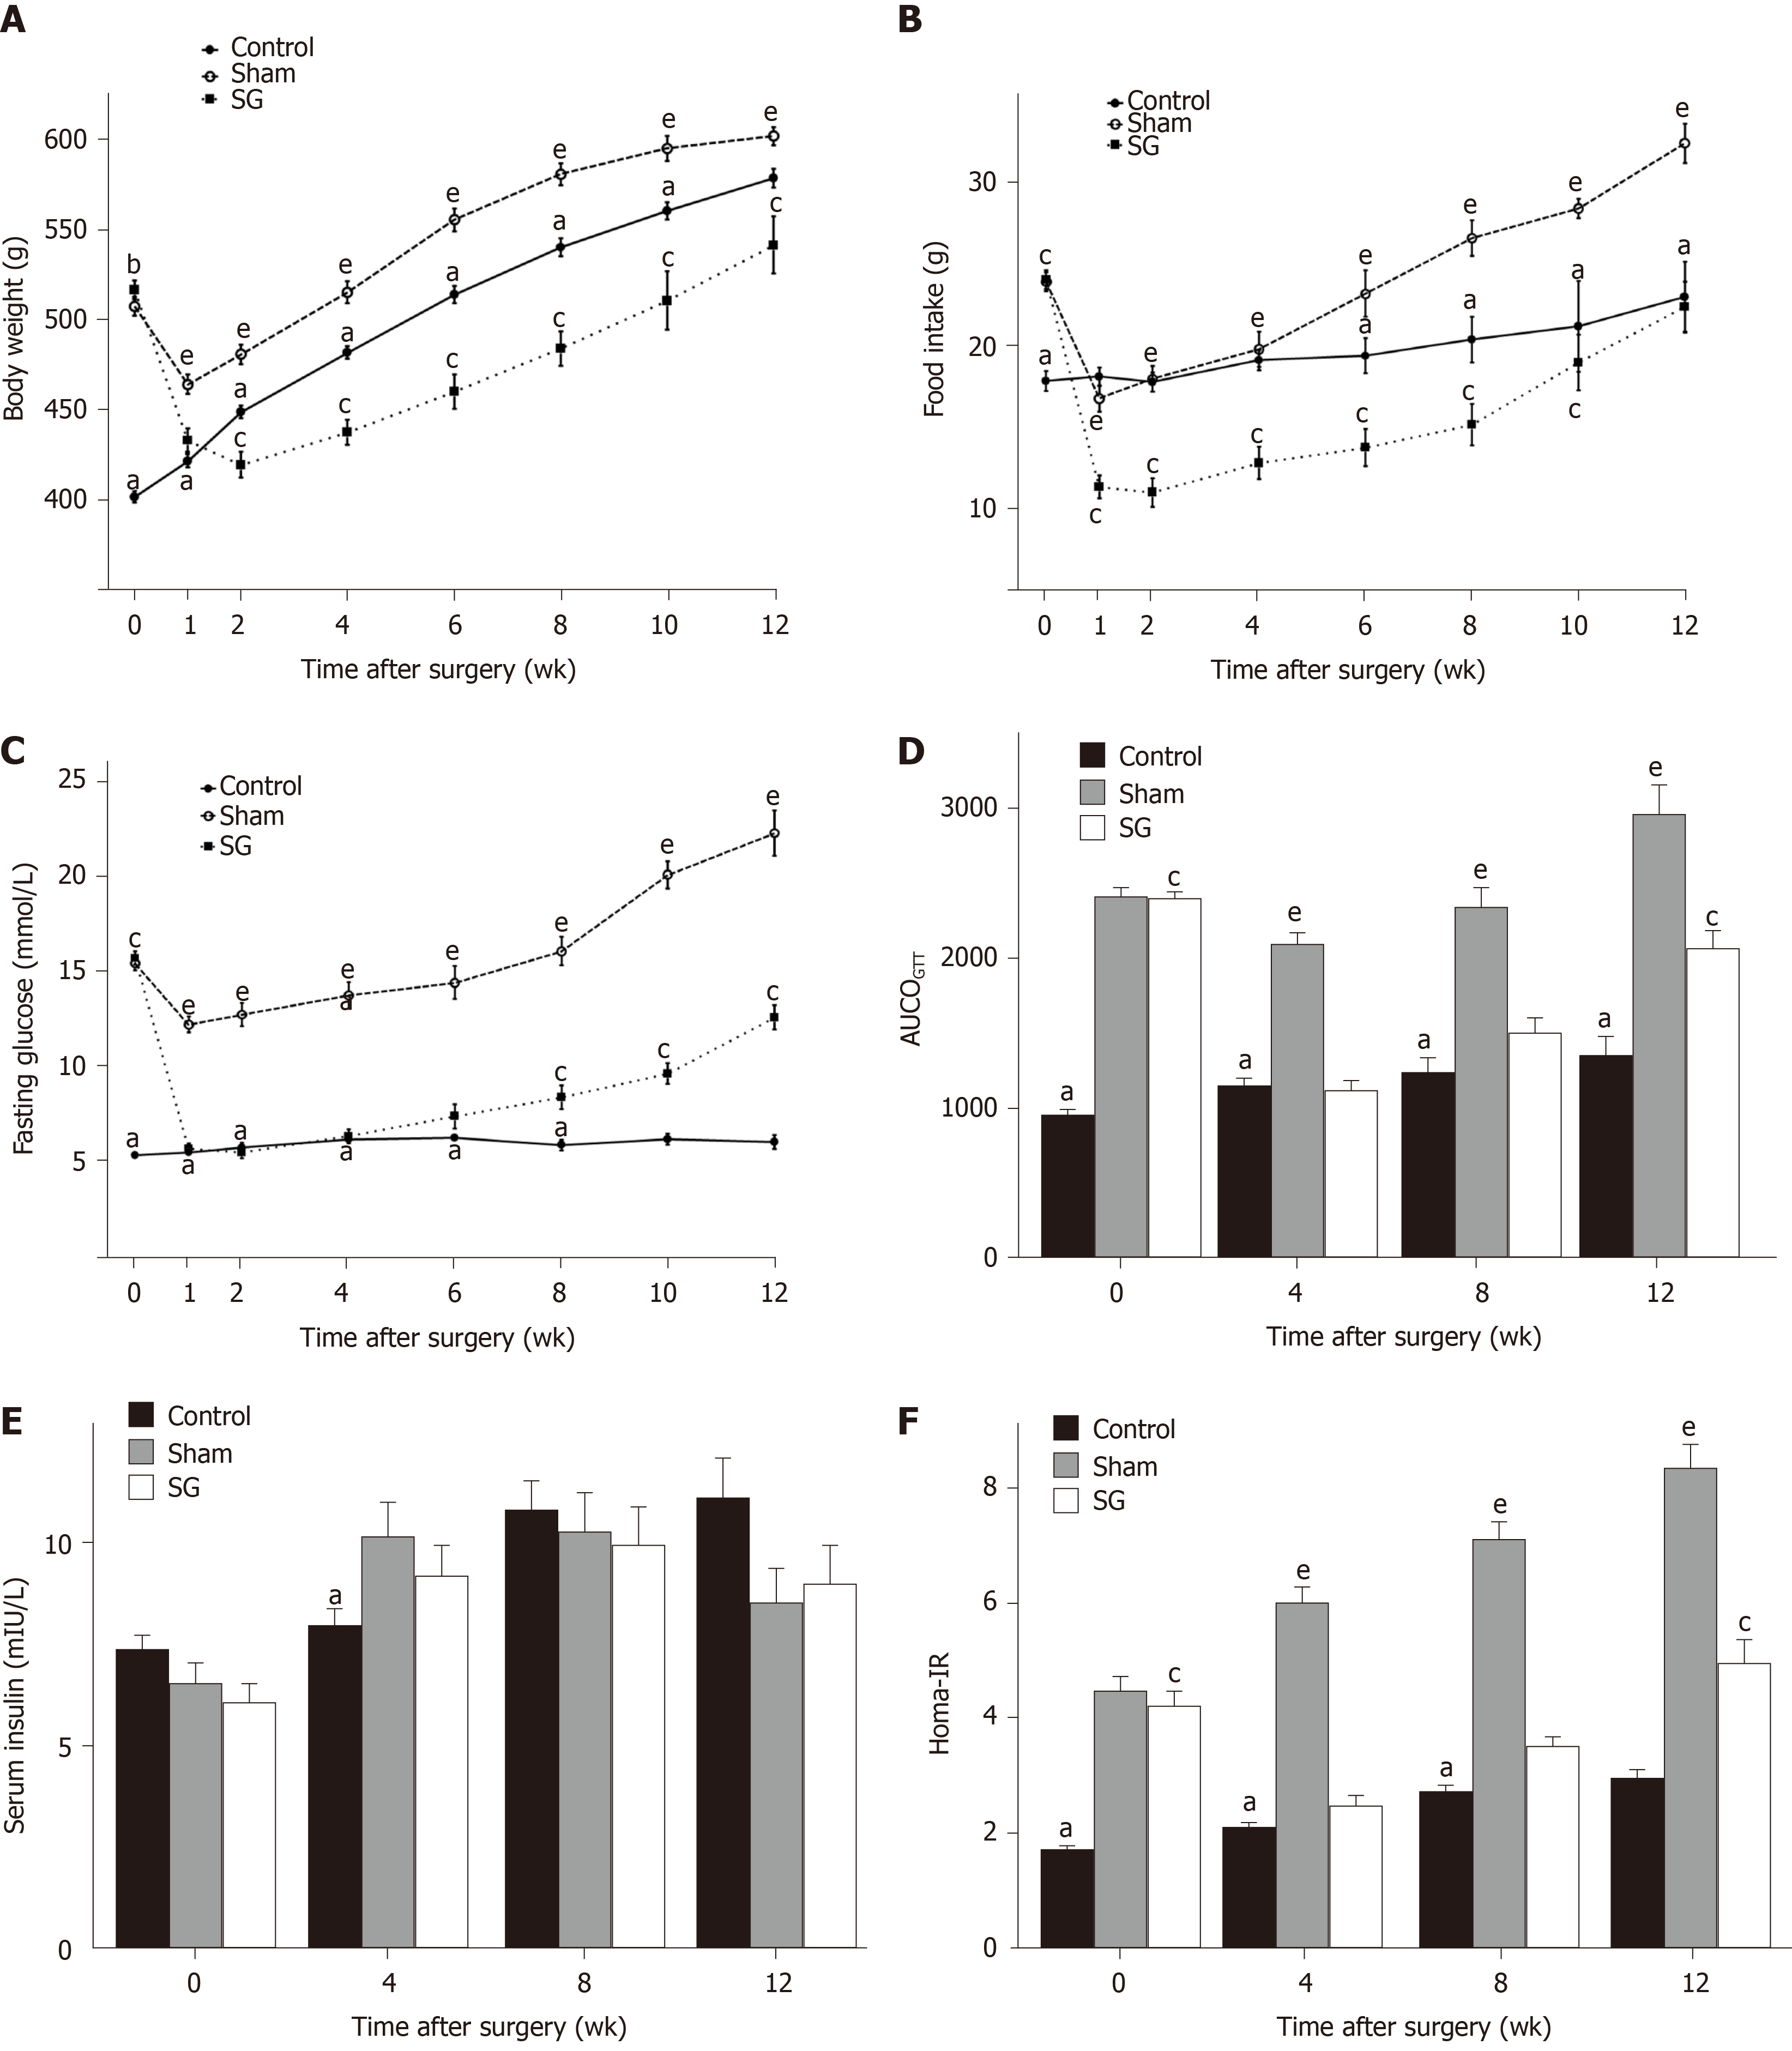
Figure 2 Comparisons of metabolic parameters among groups.
A: Body weight; B: Food intake; C: Fasting glucose level; D: Area under the curve of oral glucose tolerance test; E: Fasting serum insulin level; F: Homeostasis model assessment of insulin resistance compared to sham-operated and control rats. aP < 0.05: Control vs sham; cP < 0.05: Control vs sleeve gastrectomy; eP < 0.05: Sham vs sleeve gastrectomy. AUCOGTT: Area under the curve of oral glucose tolerance test; Homa-IR: Homeostasis model assessment of insulin resistance; SG: Sleeve gastrectomy.
- Citation: Ruze R, Xiong YC, Li JW, Zhong MW, Xu Q, Yan ZB, Zhu JK, Cheng YG, Hu SY, Zhang GY. Sleeve gastrectomy ameliorates endothelial function and prevents lung cancer by normalizing endothelin-1 axis in obese and diabetic rats. World J Gastroenterol 2020; 26(20): 2599-2617
- URL: https://www.wjgnet.com/1007-9327/full/v26/i20/2599.htm
- DOI: https://dx.doi.org/10.3748/wjg.v26.i20.2599


