Copyright
©The Author(s) 2020.
World J Gastroenterol. Jan 14, 2020; 26(2): 246-265
Published online Jan 14, 2020. doi: 10.3748/wjg.v26.i2.246
Published online Jan 14, 2020. doi: 10.3748/wjg.v26.i2.246
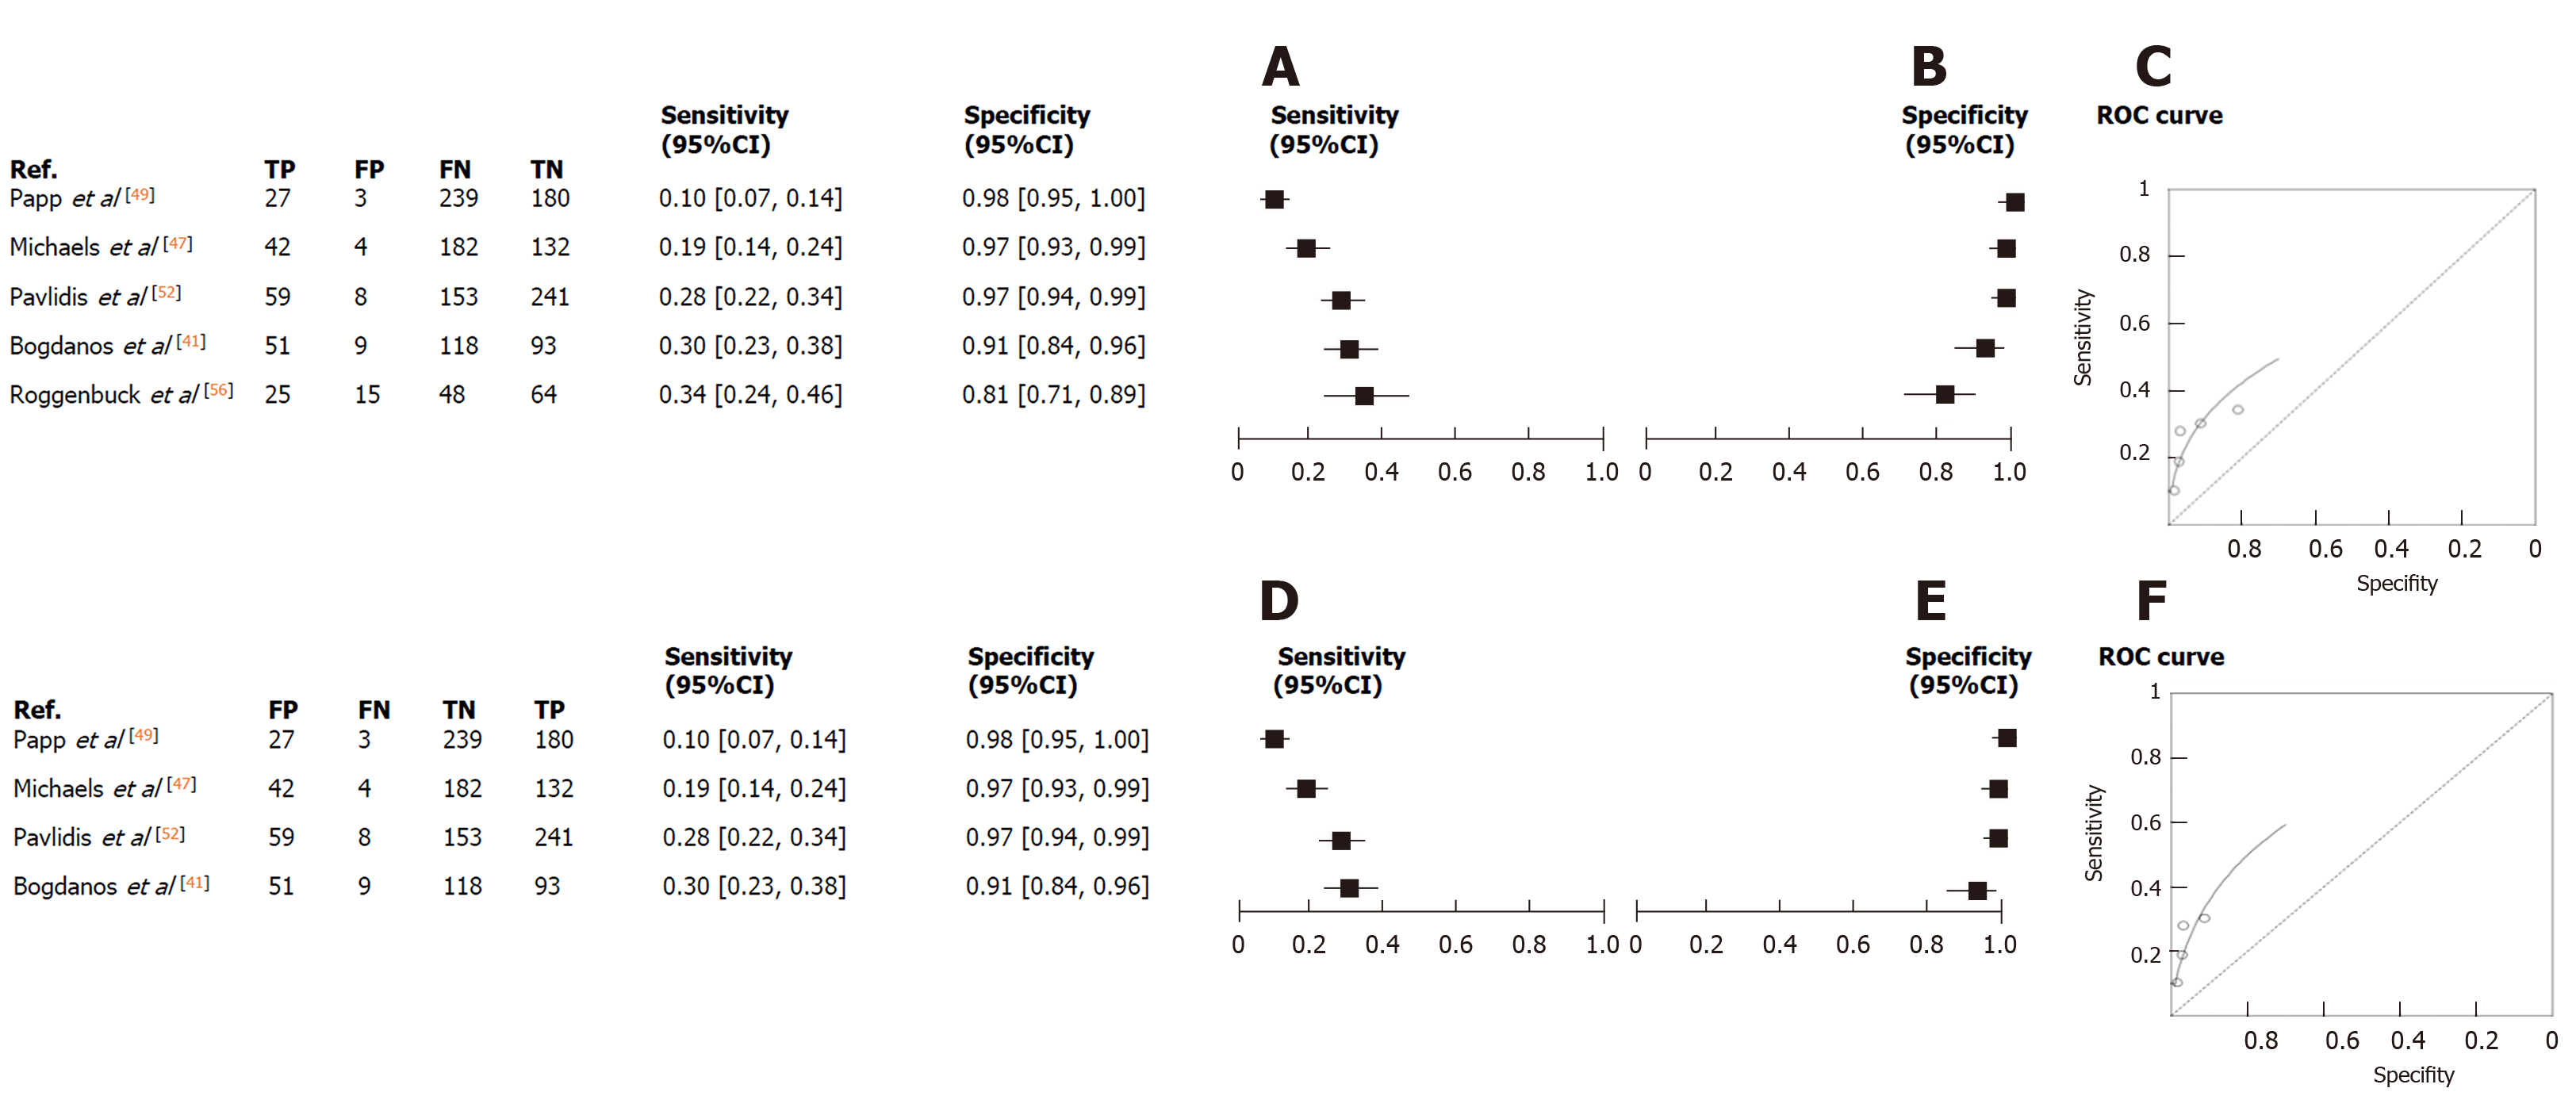
Figure 5 Pooled forest plots.
A-C: Pooled forest plots for sensitivity and specificity, and the summary receiver operating characteristic curves of anti-GP2 antibody (IgA and/or IgG positive) for Crohn’s Disease against all patients with relevant symptoms; D-F: Pooled forest plots for sensitivity and specificity, and the summary receiver operating characteristic curves of anti-GP2 antibody (IgA and/or IgG positive) for patients with Crohn’s Disease against patients with Ulcerative colitis. FN: False negative; FP: False positive; ROC: Receiver operating characteristic; TN: True negative; TP: True positive; CI: Confidence interval.
- Citation: Gkiouras K, Grammatikopoulou MG, Theodoridis X, Pagkalidou E, Chatzikyriakou E, Apostolidou AG, Rigopoulou EI, Sakkas LI, Bogdanos DP. Diagnostic and clinical significance of antigen-specific pancreatic antibodies in inflammatory bowel diseases: A meta-analysis. World J Gastroenterol 2020; 26(2): 246-265
- URL: https://www.wjgnet.com/1007-9327/full/v26/i2/246.htm
- DOI: https://dx.doi.org/10.3748/wjg.v26.i2.246


