Copyright
©The Author(s) 2020.
World J Gastroenterol. Jan 14, 2020; 26(2): 184-198
Published online Jan 14, 2020. doi: 10.3748/wjg.v26.i2.184
Published online Jan 14, 2020. doi: 10.3748/wjg.v26.i2.184
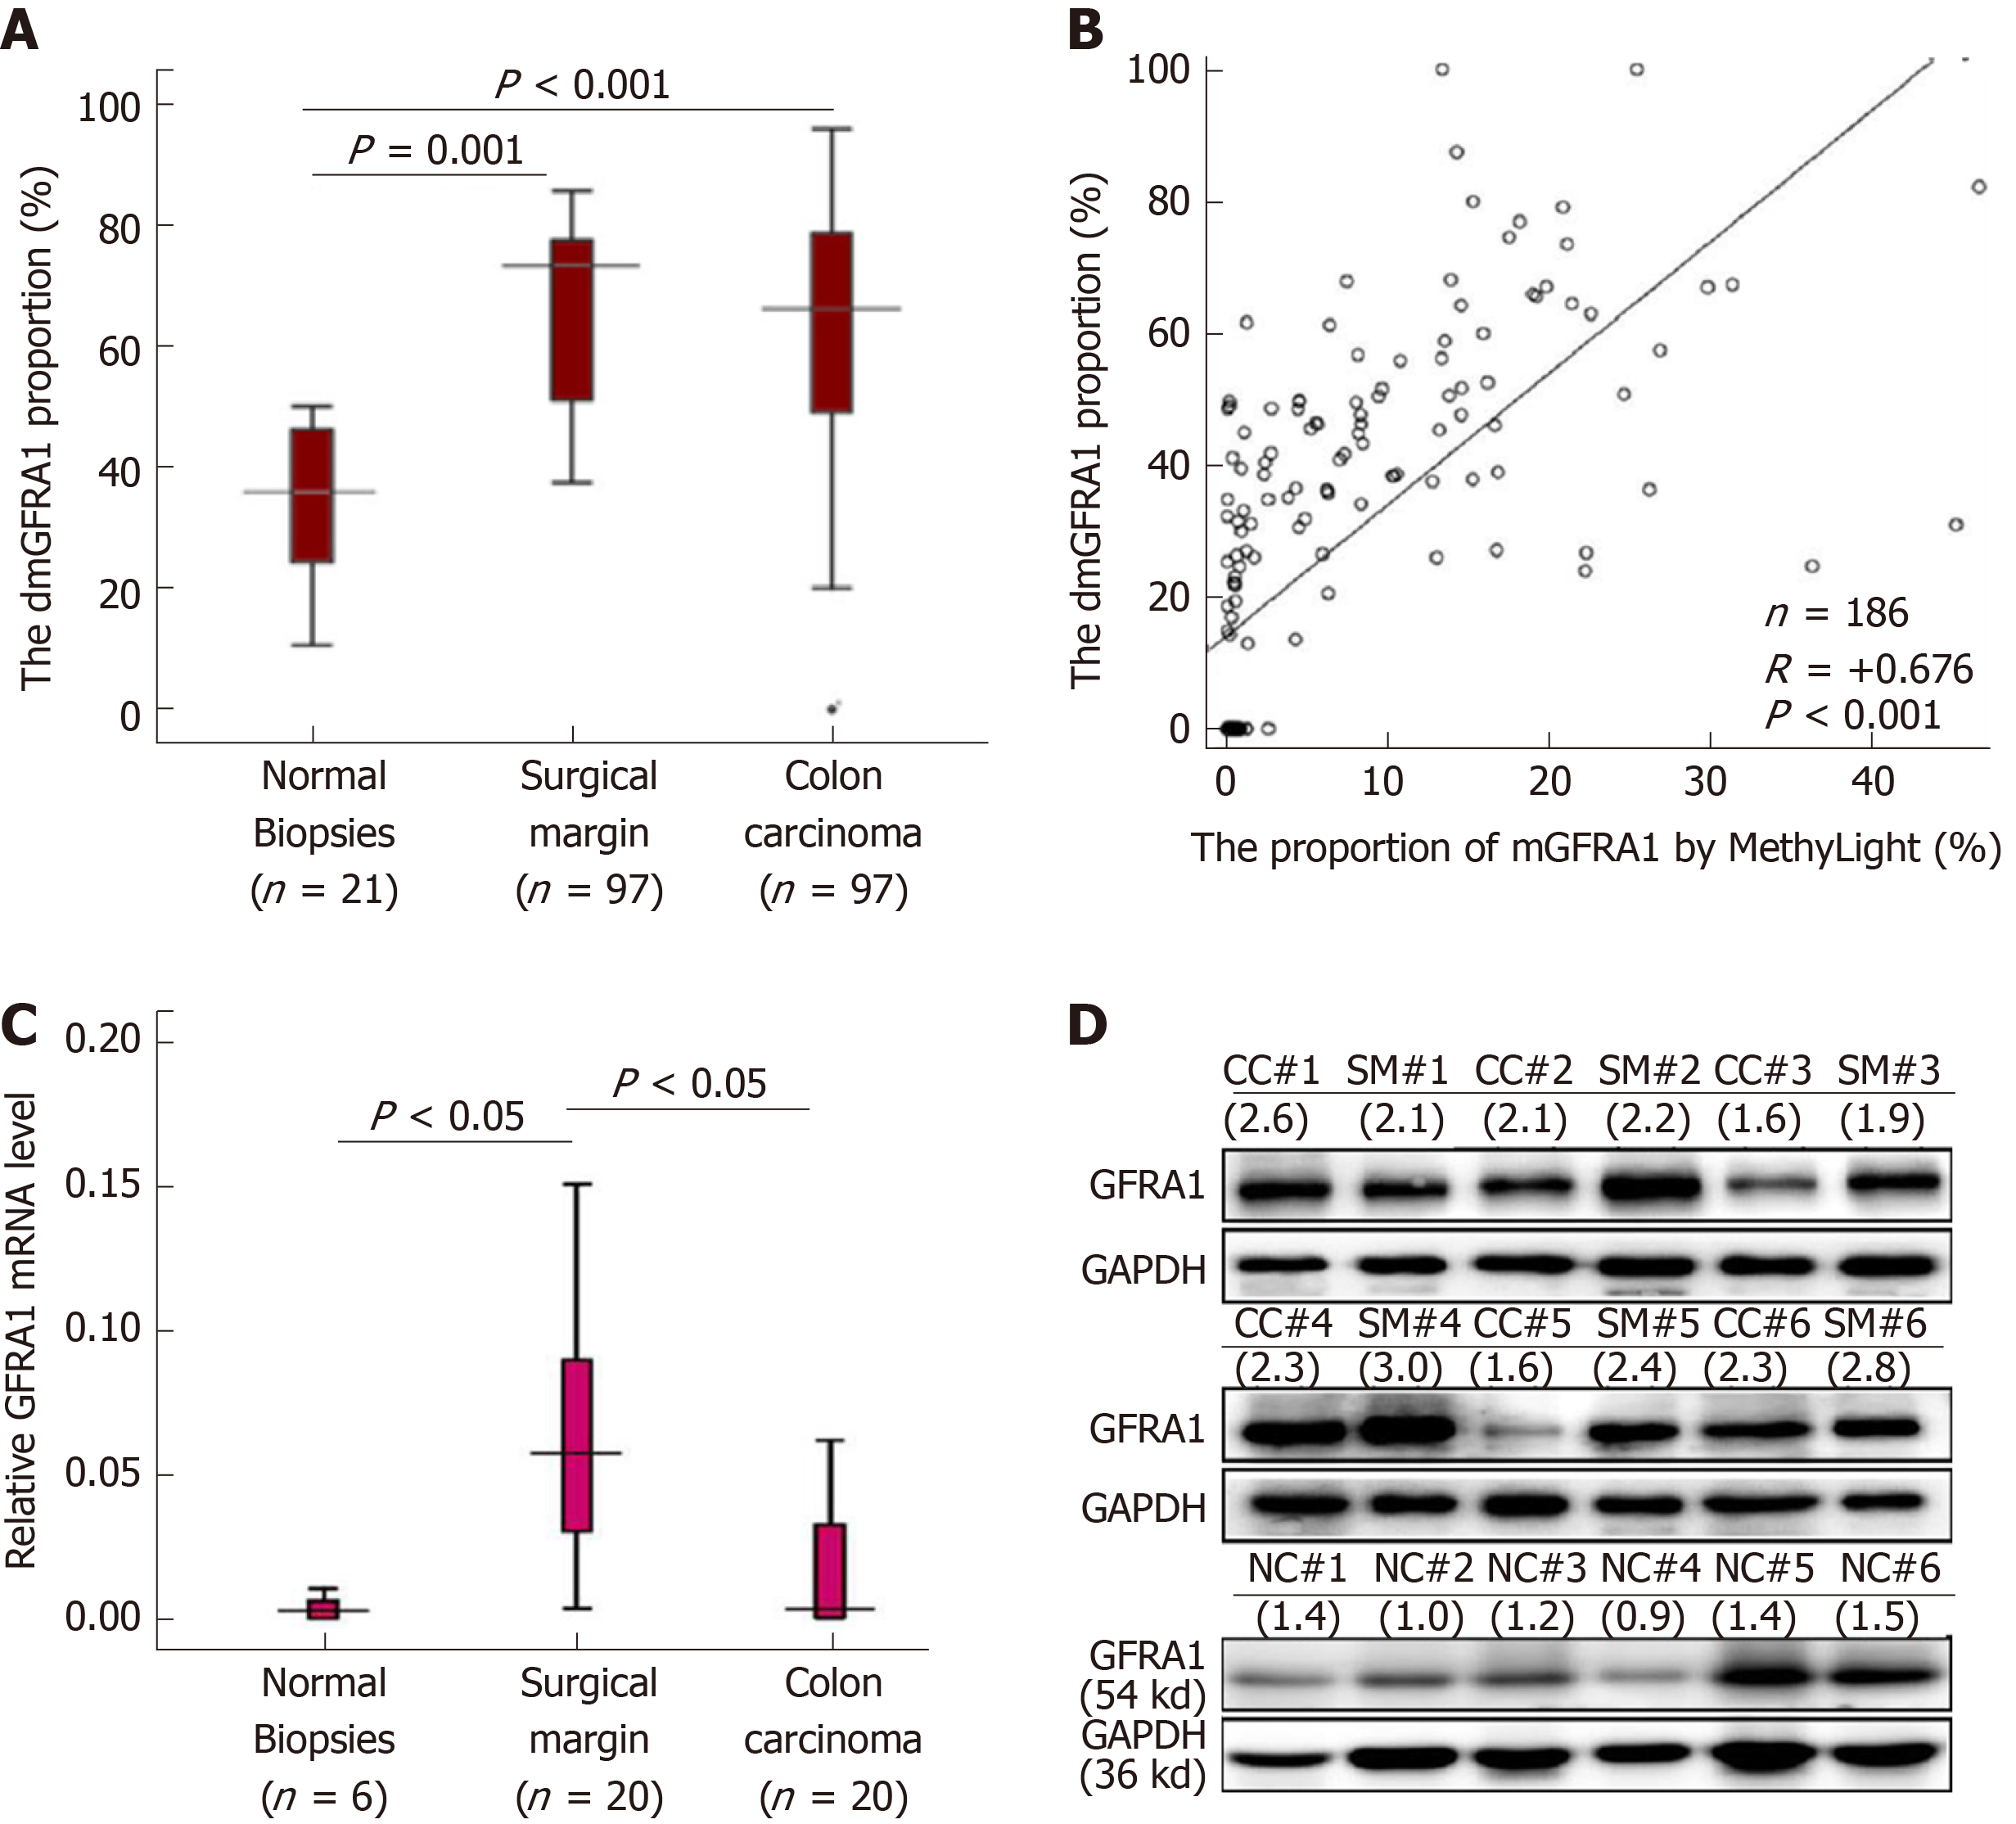
Figure 2 Demethylation and expression status of the GFRA1 gene in colon carcinoma.
A: The demethylated GFRA1 (dmGFRA1) peak area proportions in normal colon mucosal biopsies from noncancer patients (n = 21) as well as CC and SM samples from inpatients (n = 97) based on MethyLight analysis; B: Correlation analysis of the methylated GFRA1 (mGFRA1) levels in colon cancer and paired surgical margin tissue samples from 93 patients by denaturing high performance liquid chromatography and MethyLight; C: GFRA1 mRNA levels in representative colon tissue samples with different pathological lesions by qRT-PCR analysis; D: GFRA1 protein levels in the representative colon tissue samples with different pathological lesions based on Western blot analysis. The density ratio of GFRA1 to GAPDH is listed below each sample id. Note: The mGFRA1 peak area proportion (%) = 100%-the dmGFRA1 peak area proportion (%). dmGFRA1: Demethylated GFRA1; mGFRA1: Methylated GFRA1.
- Citation: Ma WR, Xu P, Liu ZJ, Zhou J, Gu LK, Zhang J, Deng DJ. Impact of GFRA1 gene reactivation by DNA demethylation on prognosis of patients with metastatic colon cancer. World J Gastroenterol 2020; 26(2): 184-198
- URL: https://www.wjgnet.com/1007-9327/full/v26/i2/184.htm
- DOI: https://dx.doi.org/10.3748/wjg.v26.i2.184


