Copyright
©The Author(s) 2020.
World J Gastroenterol. Jan 14, 2020; 26(2): 134-153
Published online Jan 14, 2020. doi: 10.3748/wjg.v26.i2.134
Published online Jan 14, 2020. doi: 10.3748/wjg.v26.i2.134
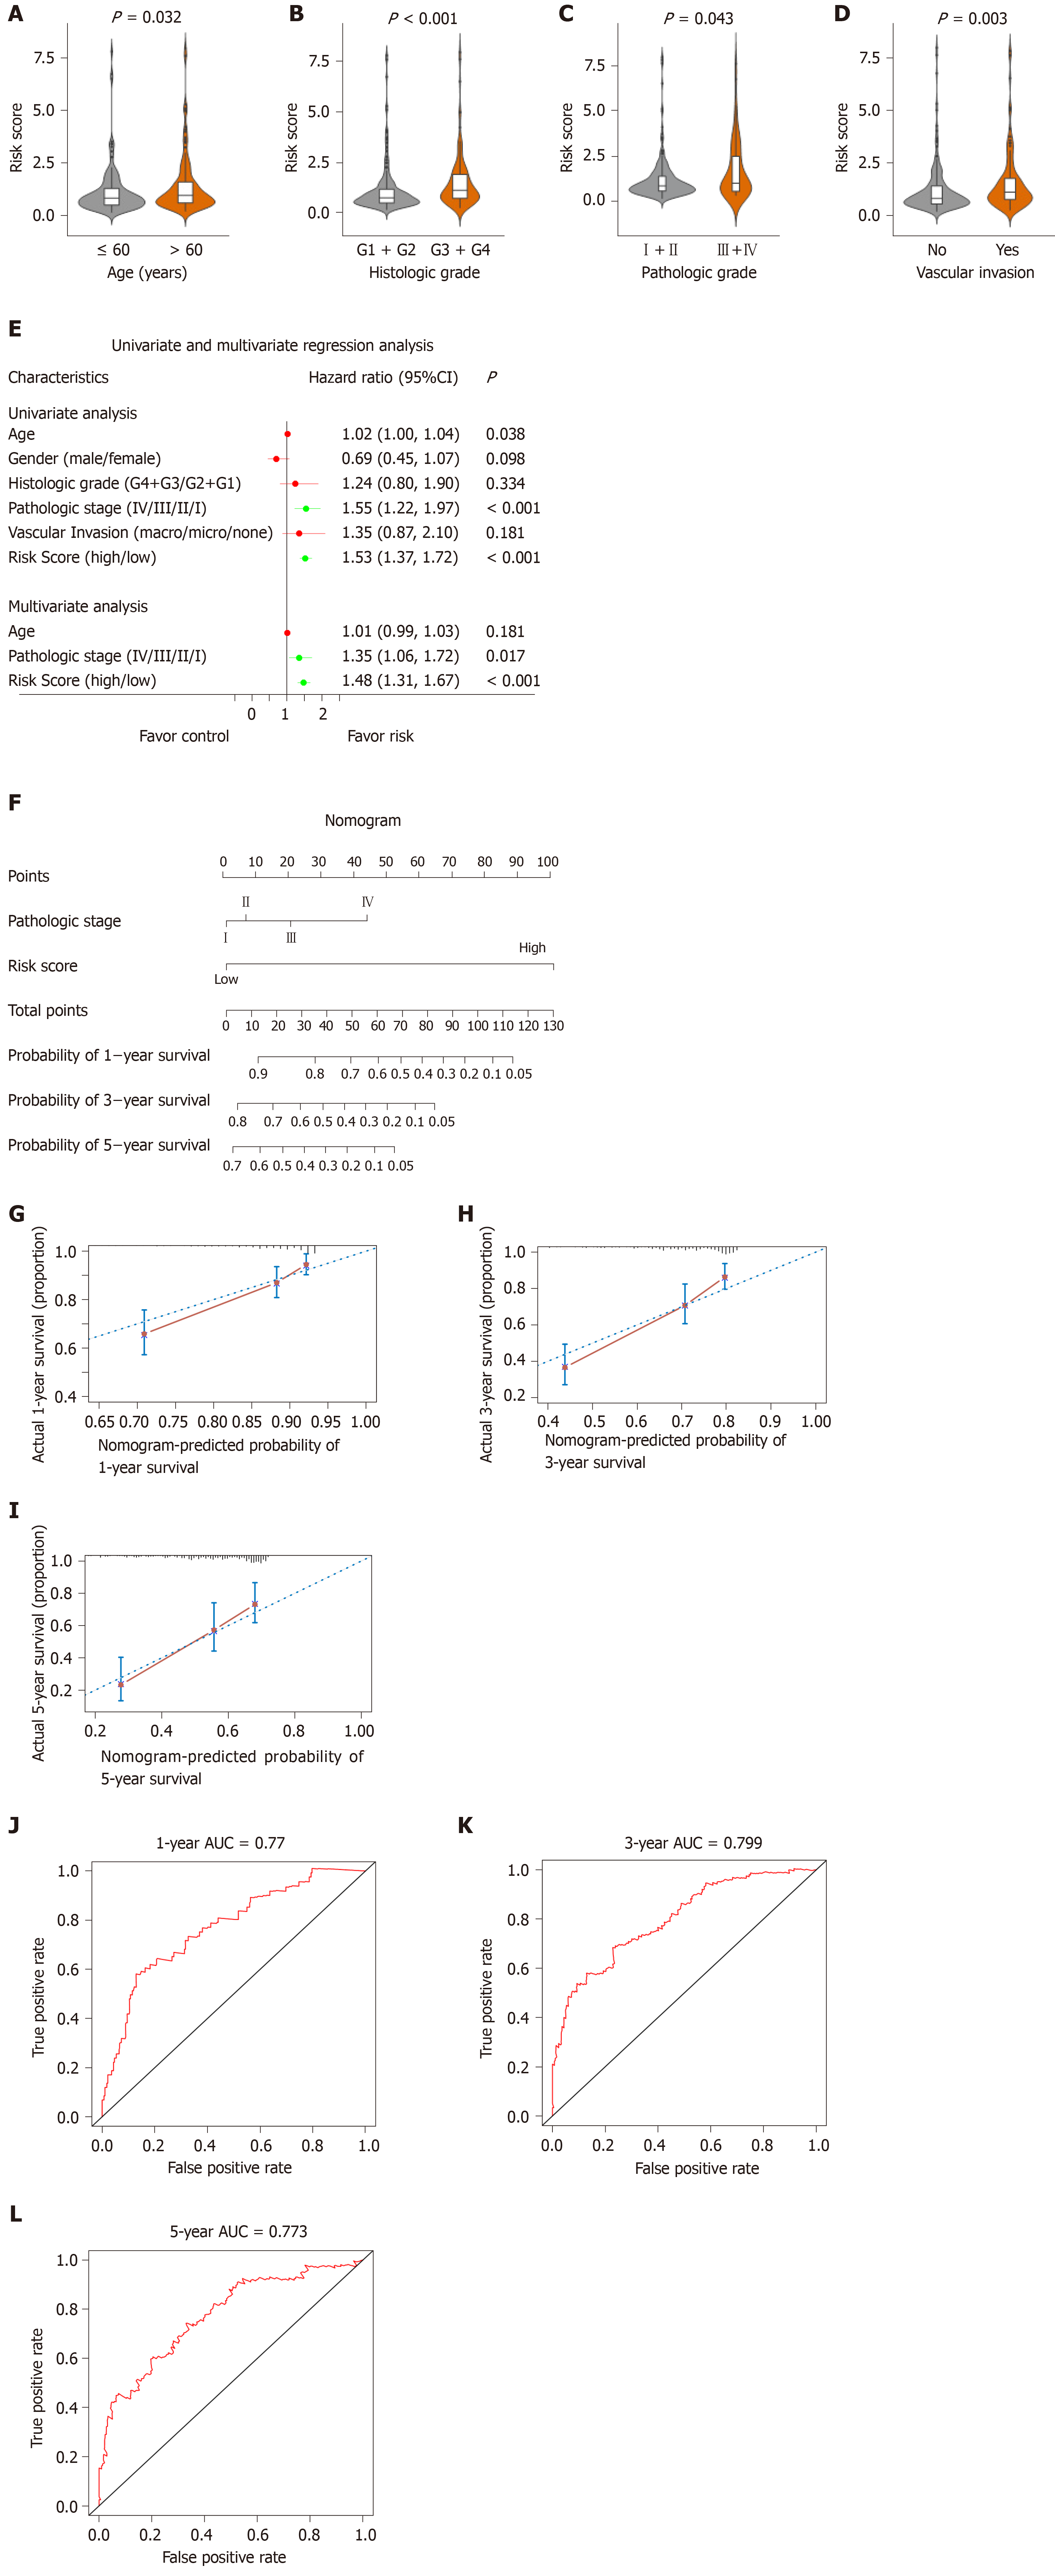
Figure 7 Relationship between the risk score model and other clinical information.
A: Correlation of the risk score with the age; B: Correlation of the risk score with the histologic grade; C: Correlation of the risk score with the pathologic stage; D: Correlation of the risk score with the vascular invasion; E: Univariate and multivariate regression analysis of the relation between the risk score prognostic model and clinicopathological features regarding prognostic value; F: Nomogram for predicting the probability of 1-, 3-, and 5-year overall survival (OS) for hepatocellular carcinoma patients; G-I: Calibration plot of the nomogram for predicting the probability of OS at 1, 3, and 5 years; J-L: Time-dependent receiver operating characteristic curve analyses of the nomogram. ROC: Receiver operating characteristic curve; CI: Confidence interval.
- Citation: Zhang FP, Huang YP, Luo WX, Deng WY, Liu CQ, Xu LB, Liu C. Construction of a risk score prognosis model based on hepatocellular carcinoma microenvironment. World J Gastroenterol 2020; 26(2): 134-153
- URL: https://www.wjgnet.com/1007-9327/full/v26/i2/134.htm
- DOI: https://dx.doi.org/10.3748/wjg.v26.i2.134


