Copyright
©The Author(s) 2020.
World J Gastroenterol. Jan 14, 2020; 26(2): 134-153
Published online Jan 14, 2020. doi: 10.3748/wjg.v26.i2.134
Published online Jan 14, 2020. doi: 10.3748/wjg.v26.i2.134
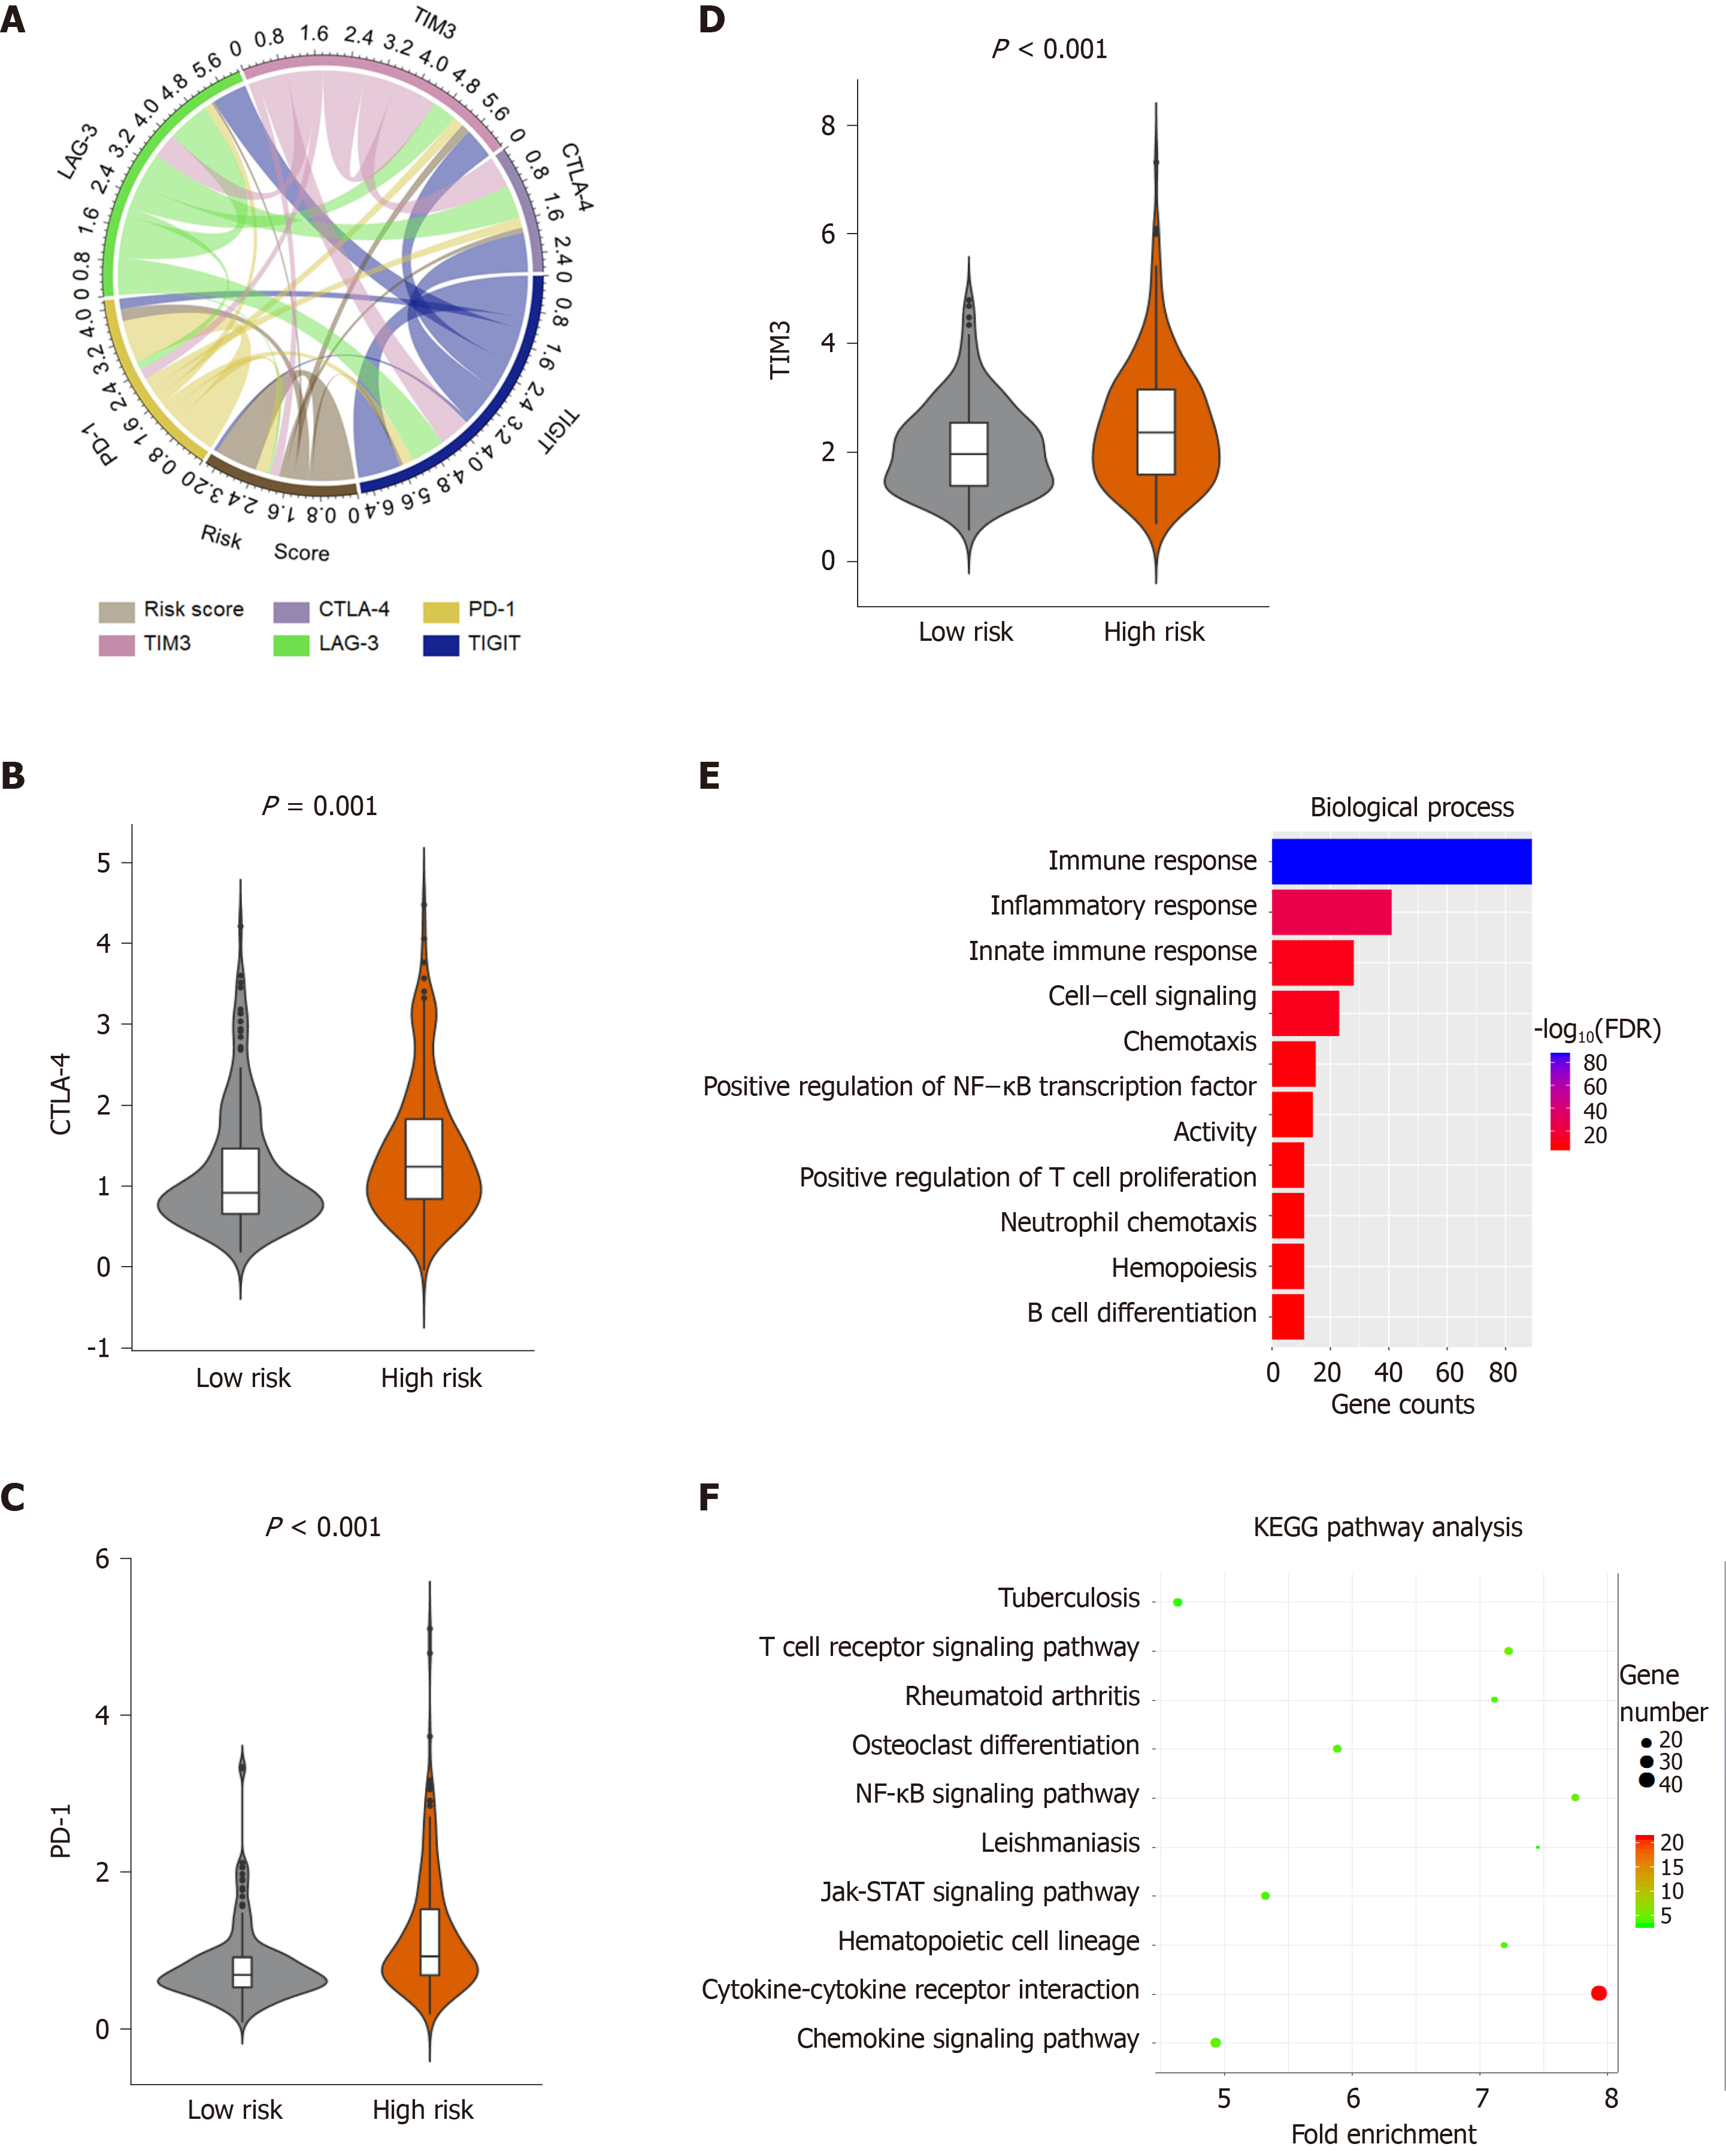
Figure 6 Enrichment analysis of the immune prognostic model.
A: Correlation of the risk score with the expression of several prominent immune checkpoints; B-D: Violin plots visualizing significantly different immune checkpoints between high-risk and low-risk patients; E-F: The Gene Ontology (GO) and Kyoto encyclopedia of genes and genomes (KEGG) analysis of immune related genes, top 10 GO terms were displayed. False Discovery Rate of GO and KEGG analysis was acquired from the DAVID functional annotation tool. CTLA-4: Cytotoxic T-Lymphocyte associated protein 4; PD-1: Programmed cell death 1; TIM-3: T-cell immunoglobulin mucin receptor 3; KEGG: Kyoto encyclopedia of genes and genomes; FDR: False discovery rate.
- Citation: Zhang FP, Huang YP, Luo WX, Deng WY, Liu CQ, Xu LB, Liu C. Construction of a risk score prognosis model based on hepatocellular carcinoma microenvironment. World J Gastroenterol 2020; 26(2): 134-153
- URL: https://www.wjgnet.com/1007-9327/full/v26/i2/134.htm
- DOI: https://dx.doi.org/10.3748/wjg.v26.i2.134


