Copyright
©The Author(s) 2020.
World J Gastroenterol. Apr 14, 2020; 26(14): 1647-1659
Published online Apr 14, 2020. doi: 10.3748/wjg.v26.i14.1647
Published online Apr 14, 2020. doi: 10.3748/wjg.v26.i14.1647
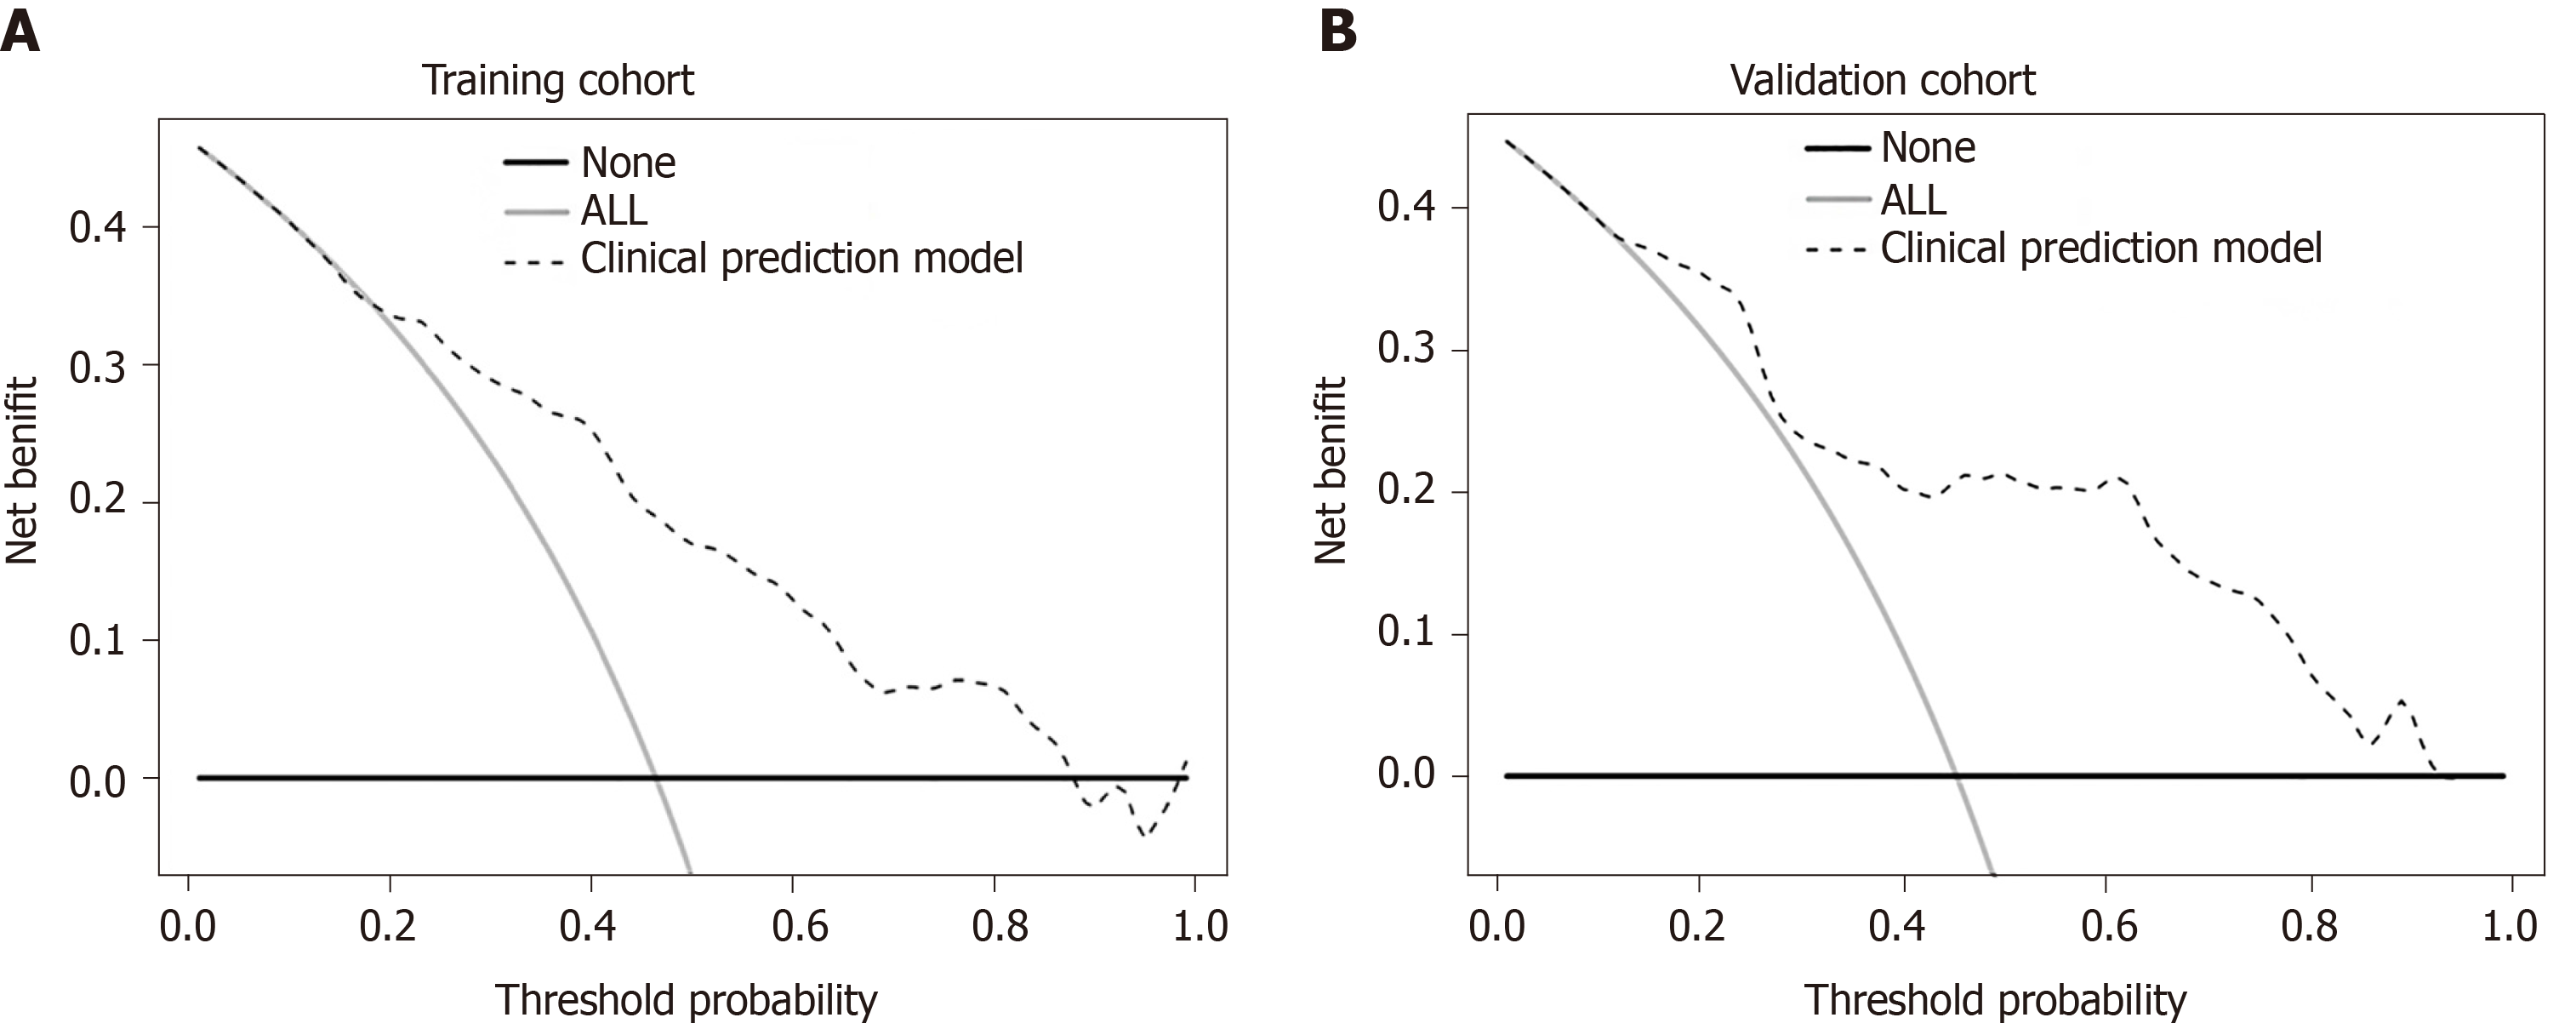
Figure 4 Decision curve analysis for the prediction model.
The gray and black lines indicate patients that were microvascular invasion (MVI) positive or negative, respectively. The dashed line represents the net benefit of the nomogram at different threshold probabilities. The net clinical benefit was calculated as the true-positive rate minus the weighted false-positive rate. A: Decision curve analysis for MVI in the training cohort; B: Decision curve analysis for MVI in the validation cohort.
- Citation: Wang L, Jin YX, Ji YZ, Mu Y, Zhang SC, Pan SY. Development and validation of a prediction model for microvascular invasion in hepatocellular carcinoma. World J Gastroenterol 2020; 26(14): 1647-1659
- URL: https://www.wjgnet.com/1007-9327/full/v26/i14/1647.htm
- DOI: https://dx.doi.org/10.3748/wjg.v26.i14.1647


