Copyright
©The Author(s) 2020.
World J Gastroenterol. Apr 14, 2020; 26(14): 1601-1612
Published online Apr 14, 2020. doi: 10.3748/wjg.v26.i14.1601
Published online Apr 14, 2020. doi: 10.3748/wjg.v26.i14.1601
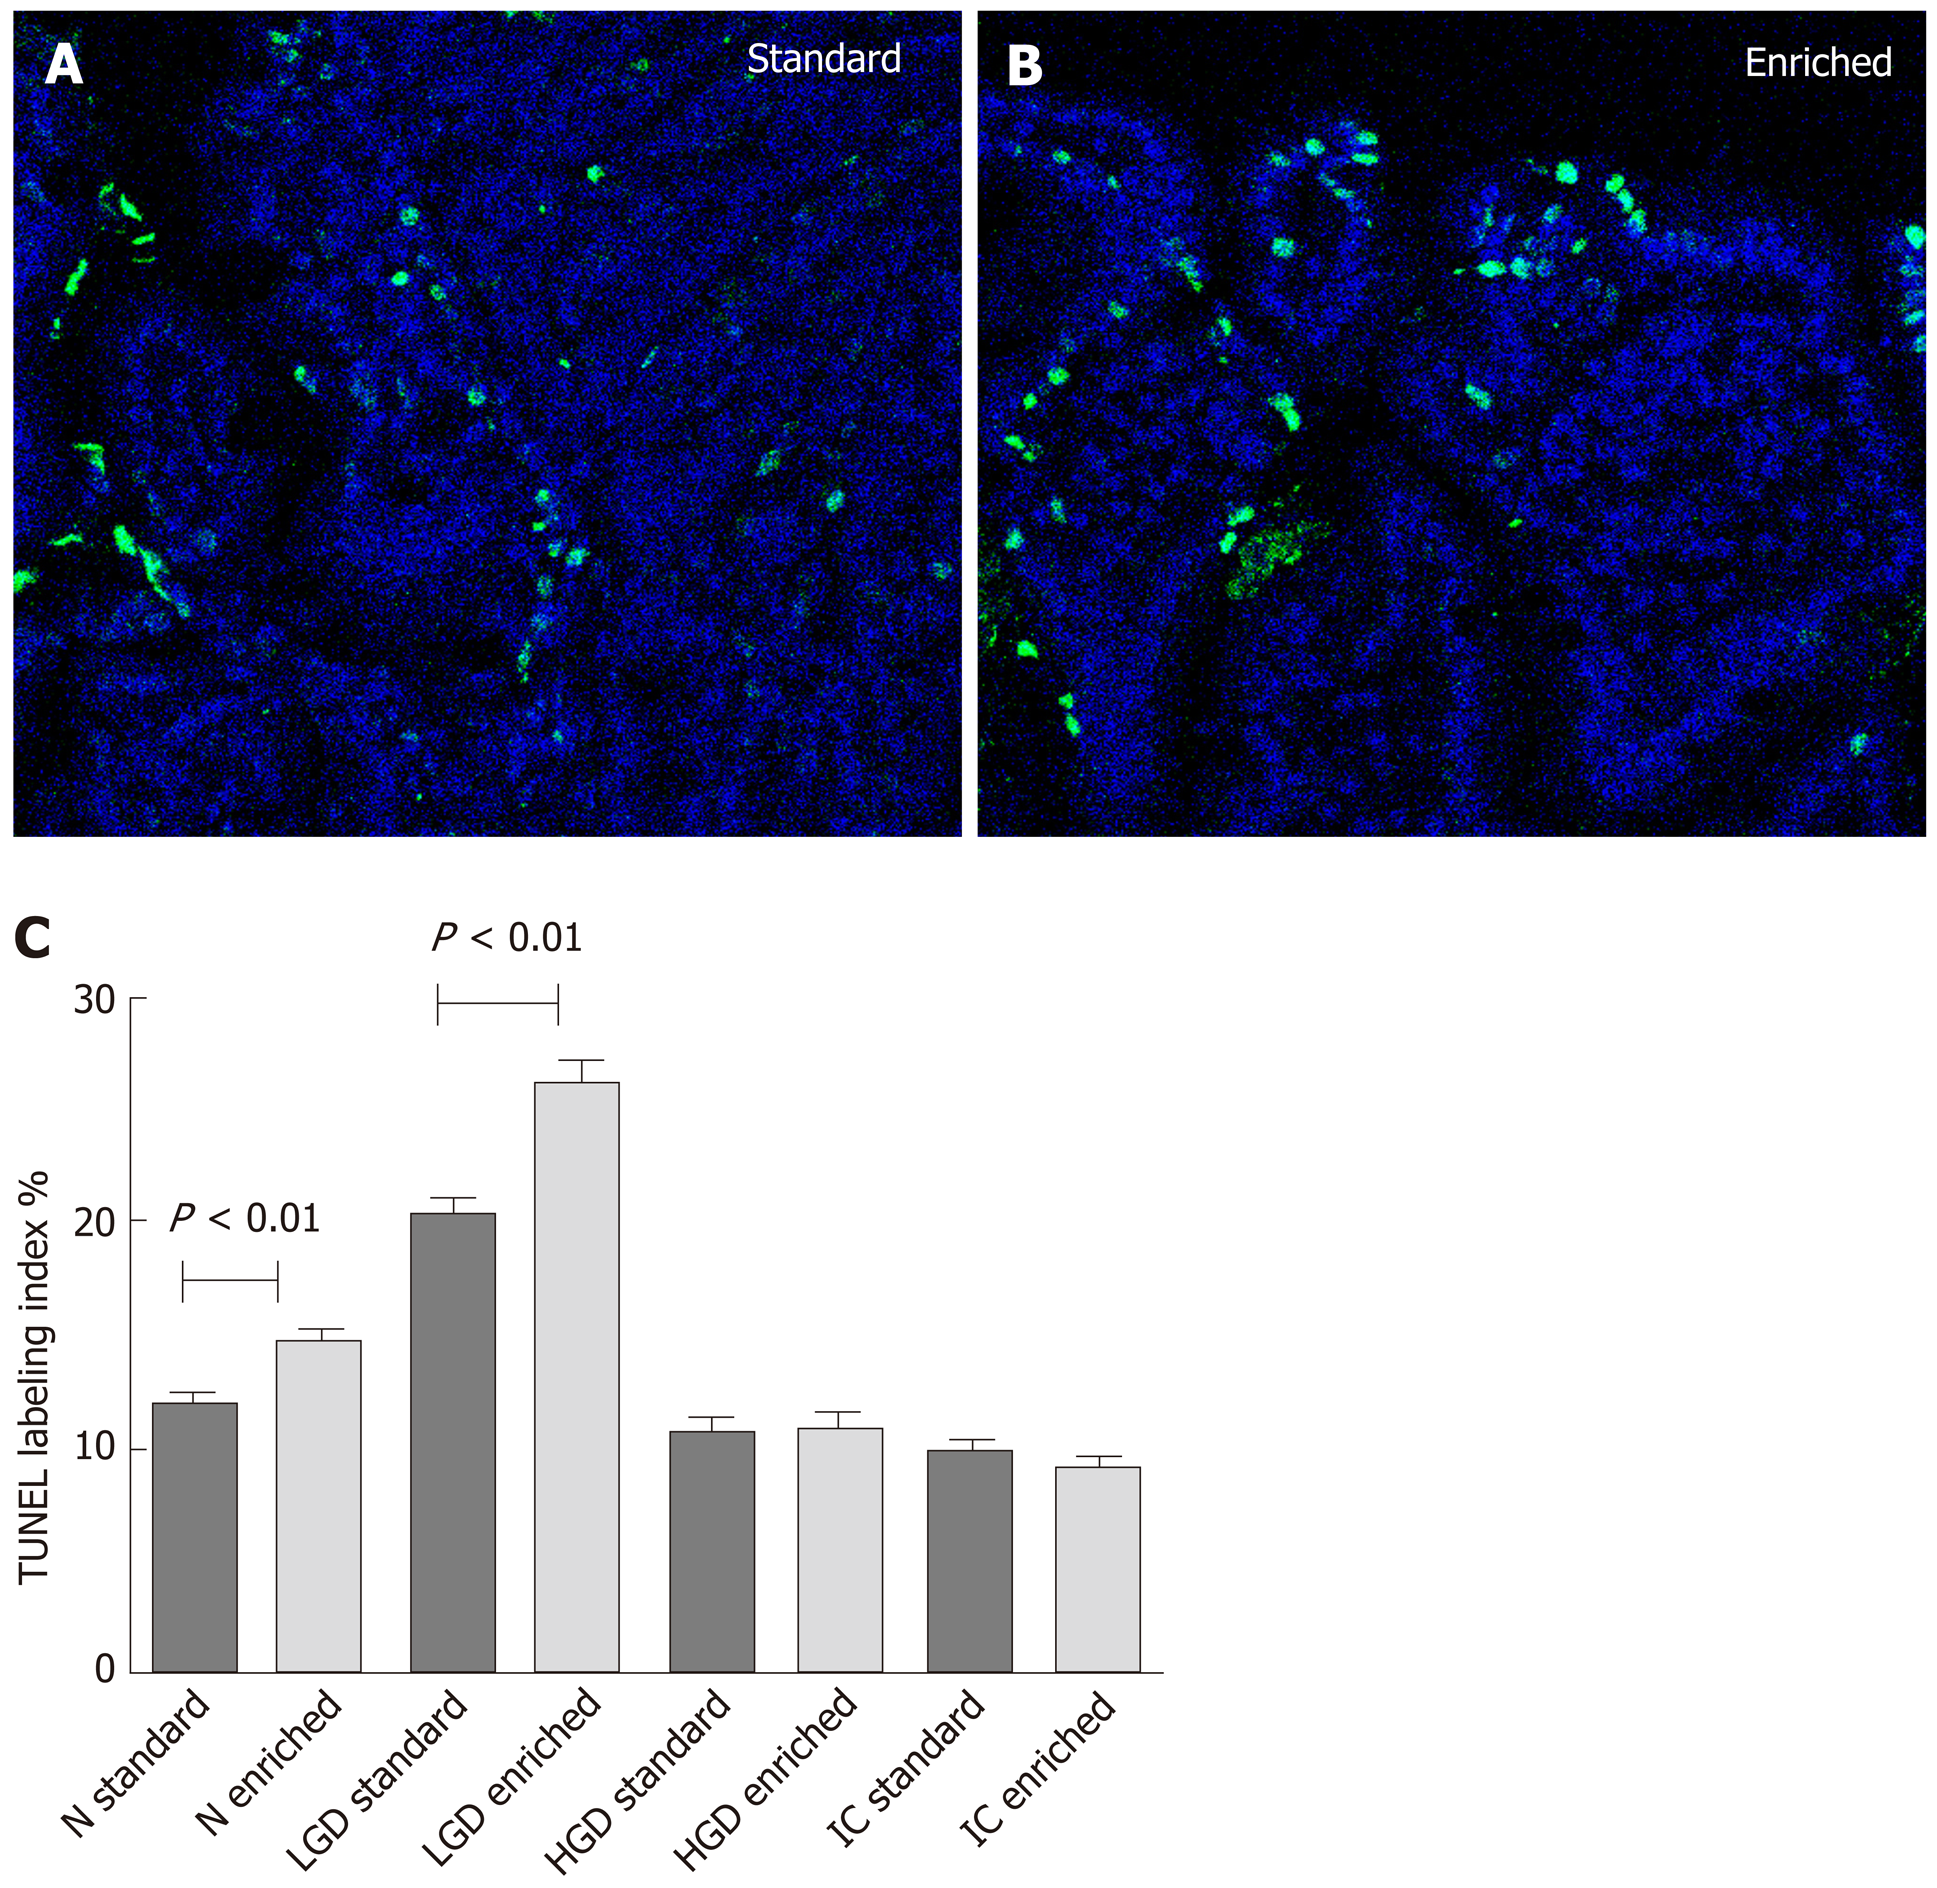
Figure 4 Immuno-fluorescent TUNEL expression.
A, B: Immuno-fluorescent TUNEL expression in low grade dysplasia (LGD) areas of both the standard (A) and enriched diet group (B). Positive cells are stained green and negative ones blue (magnification: 630 ×). C: The statistical comparison of labeling index. LGD: Low-grade dysplasia; HGD: High grade dysplasia; IC: Intestinal carcinoma.
- Citation: Girardi B, Pricci M, Giorgio F, Piazzolla M, Iannone A, Losurdo G, Principi M, Barone M, Ierardi E, Di Leo A. Silymarin, boswellic acid and curcumin enriched dietetic formulation reduces the growth of inherited intestinal polyps in an animal model. World J Gastroenterol 2020; 26(14): 1601-1612
- URL: https://www.wjgnet.com/1007-9327/full/v26/i14/1601.htm
- DOI: https://dx.doi.org/10.3748/wjg.v26.i14.1601


