Copyright
©The Author(s) 2020.
World J Gastroenterol. Apr 7, 2020; 26(13): 1439-1449
Published online Apr 7, 2020. doi: 10.3748/wjg.v26.i13.1439
Published online Apr 7, 2020. doi: 10.3748/wjg.v26.i13.1439
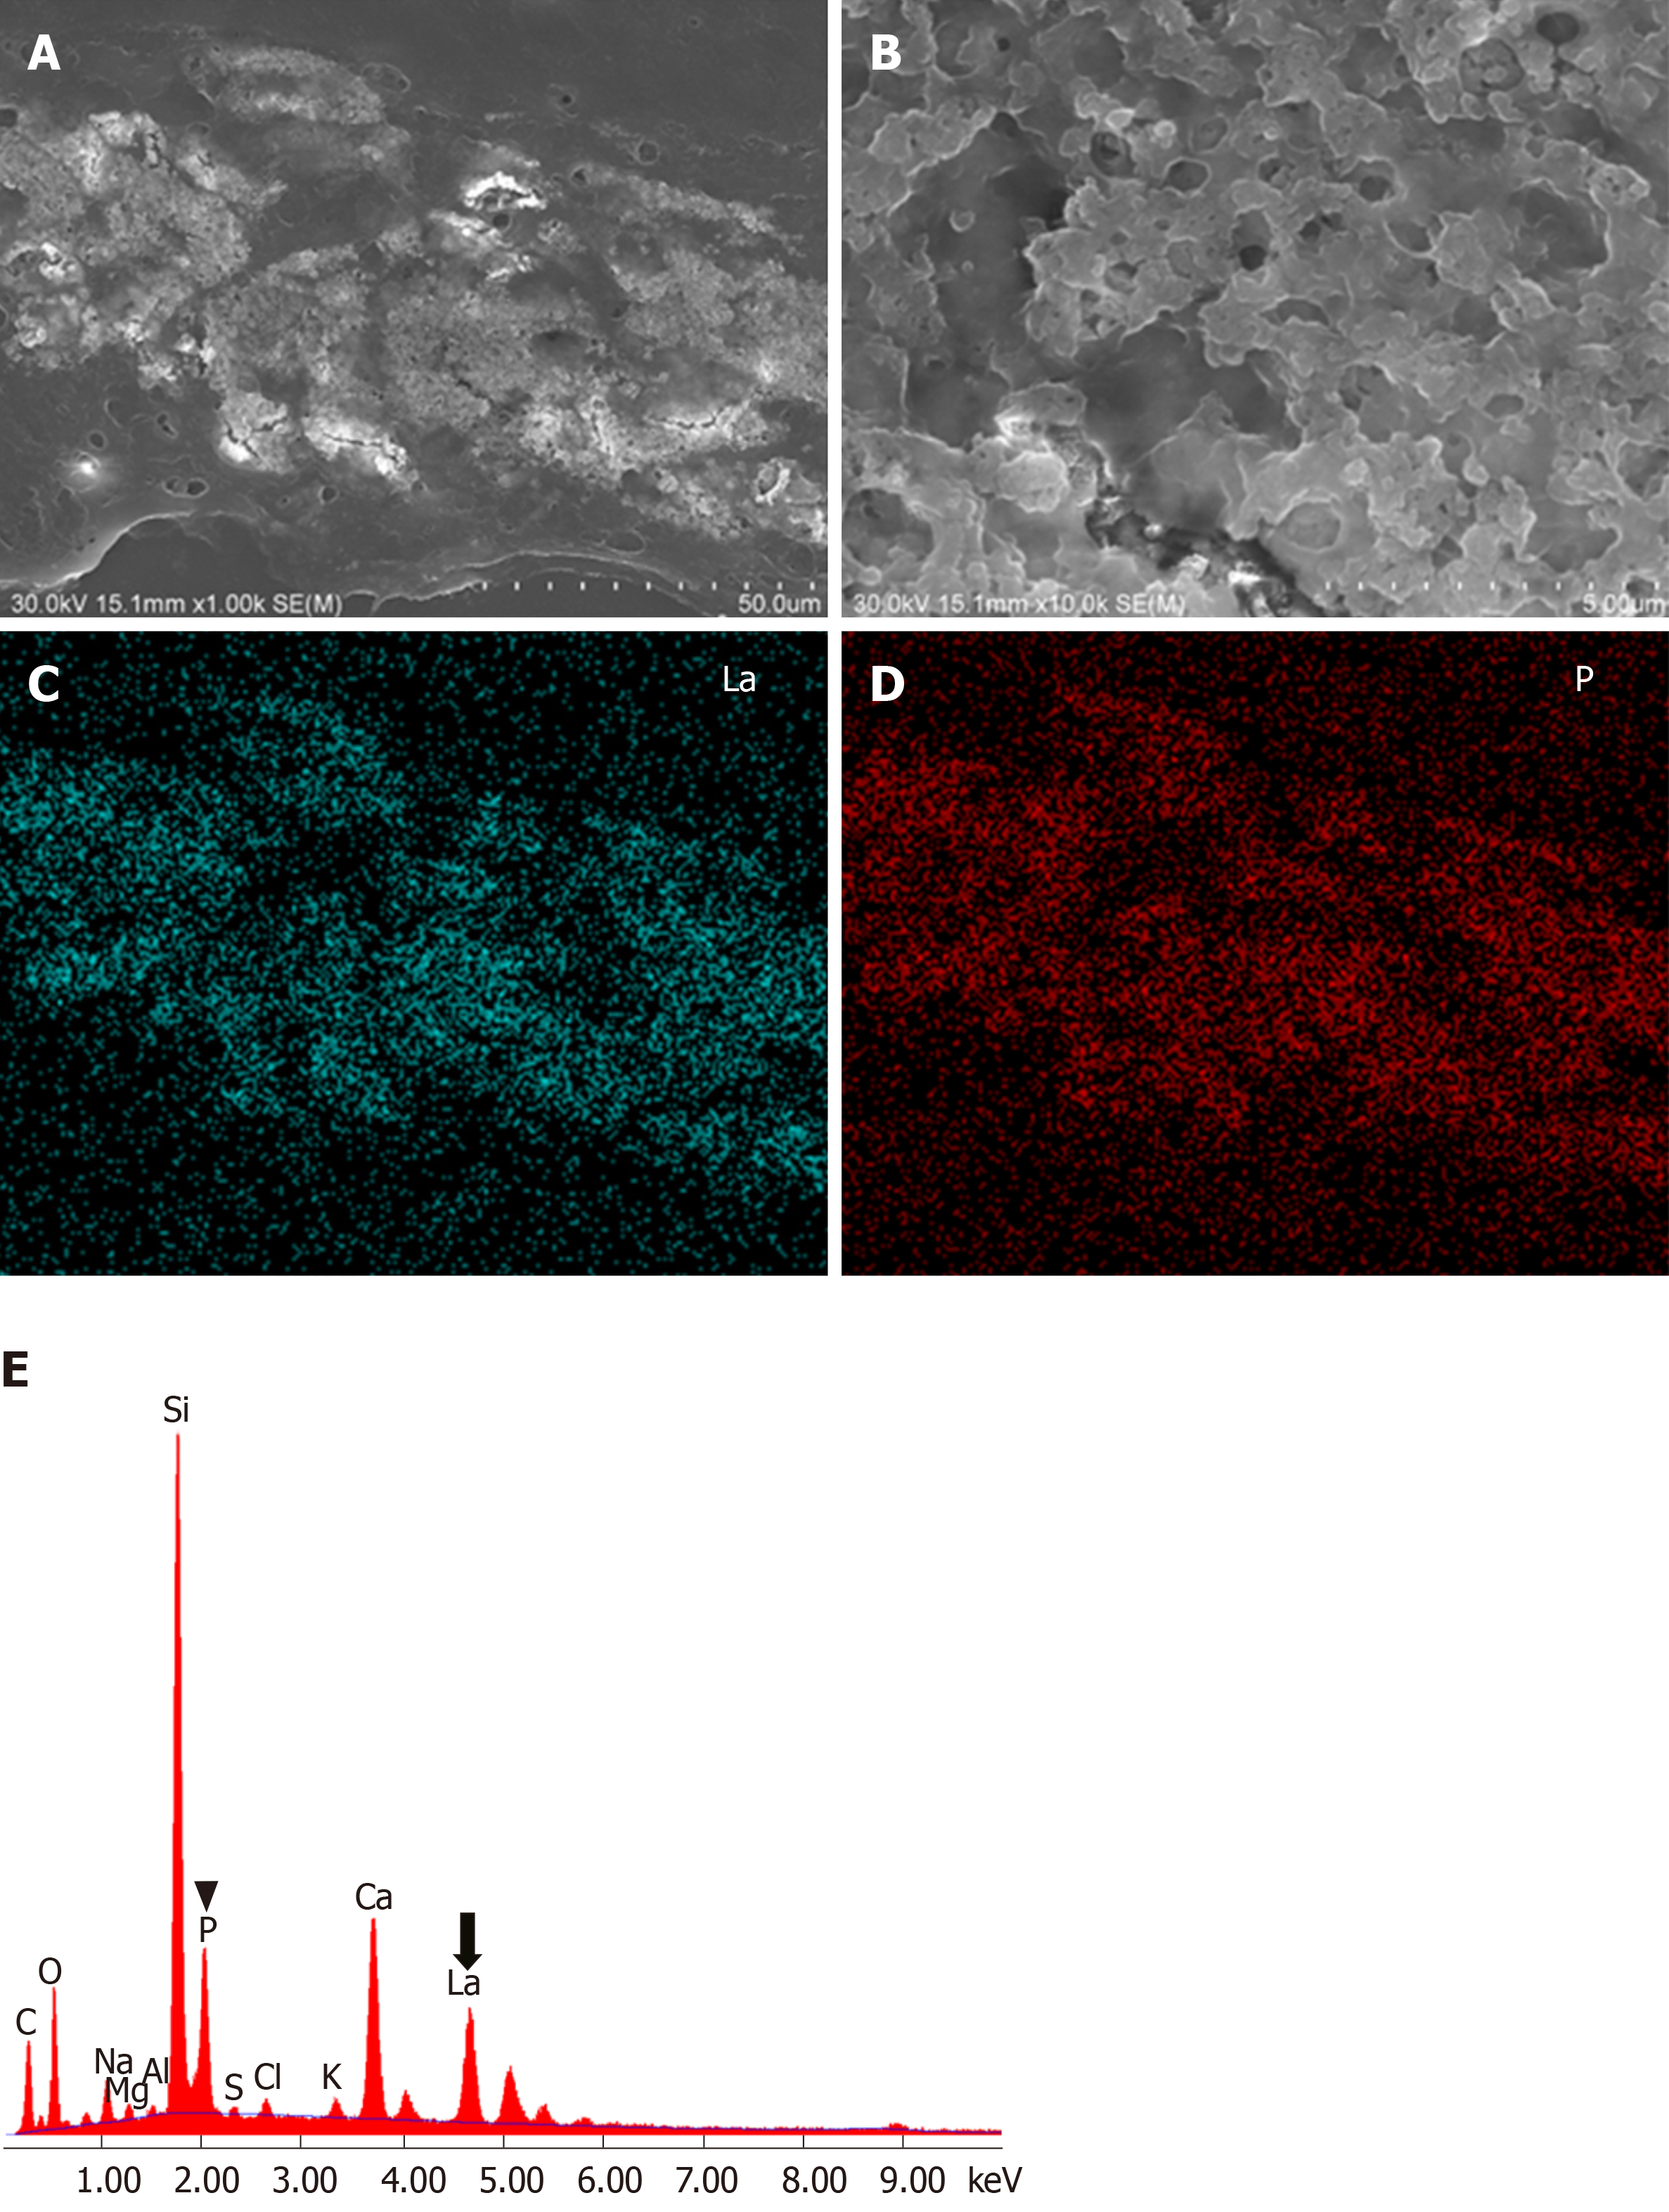
Figure 2 Electron microscopy analysis of gastric lanthanum deposition.
A: In scanning electron microscopy, deposited lanthanum is visible as bright areas; B: Deposited lanthanum is composed of aggregates of particles; C: Elemental mapping with energy dispersive X-ray spectroscopy shows that the distribution of lanthanum; D: Phosphate is identical to that of the bright areas; E: Energy dispersive X-ray spectroscopy shows presence of lanthanum (La) and phosphate elements (P).
- Citation: Iwamuro M, Urata H, Tanaka T, Okada H. Review of the diagnosis of gastrointestinal lanthanum deposition. World J Gastroenterol 2020; 26(13): 1439-1449
- URL: https://www.wjgnet.com/1007-9327/full/v26/i13/1439.htm
- DOI: https://dx.doi.org/10.3748/wjg.v26.i13.1439


