Copyright
©The Author(s) 2020.
World J Gastroenterol. Mar 28, 2020; 26(12): 1298-1316
Published online Mar 28, 2020. doi: 10.3748/wjg.v26.i12.1298
Published online Mar 28, 2020. doi: 10.3748/wjg.v26.i12.1298
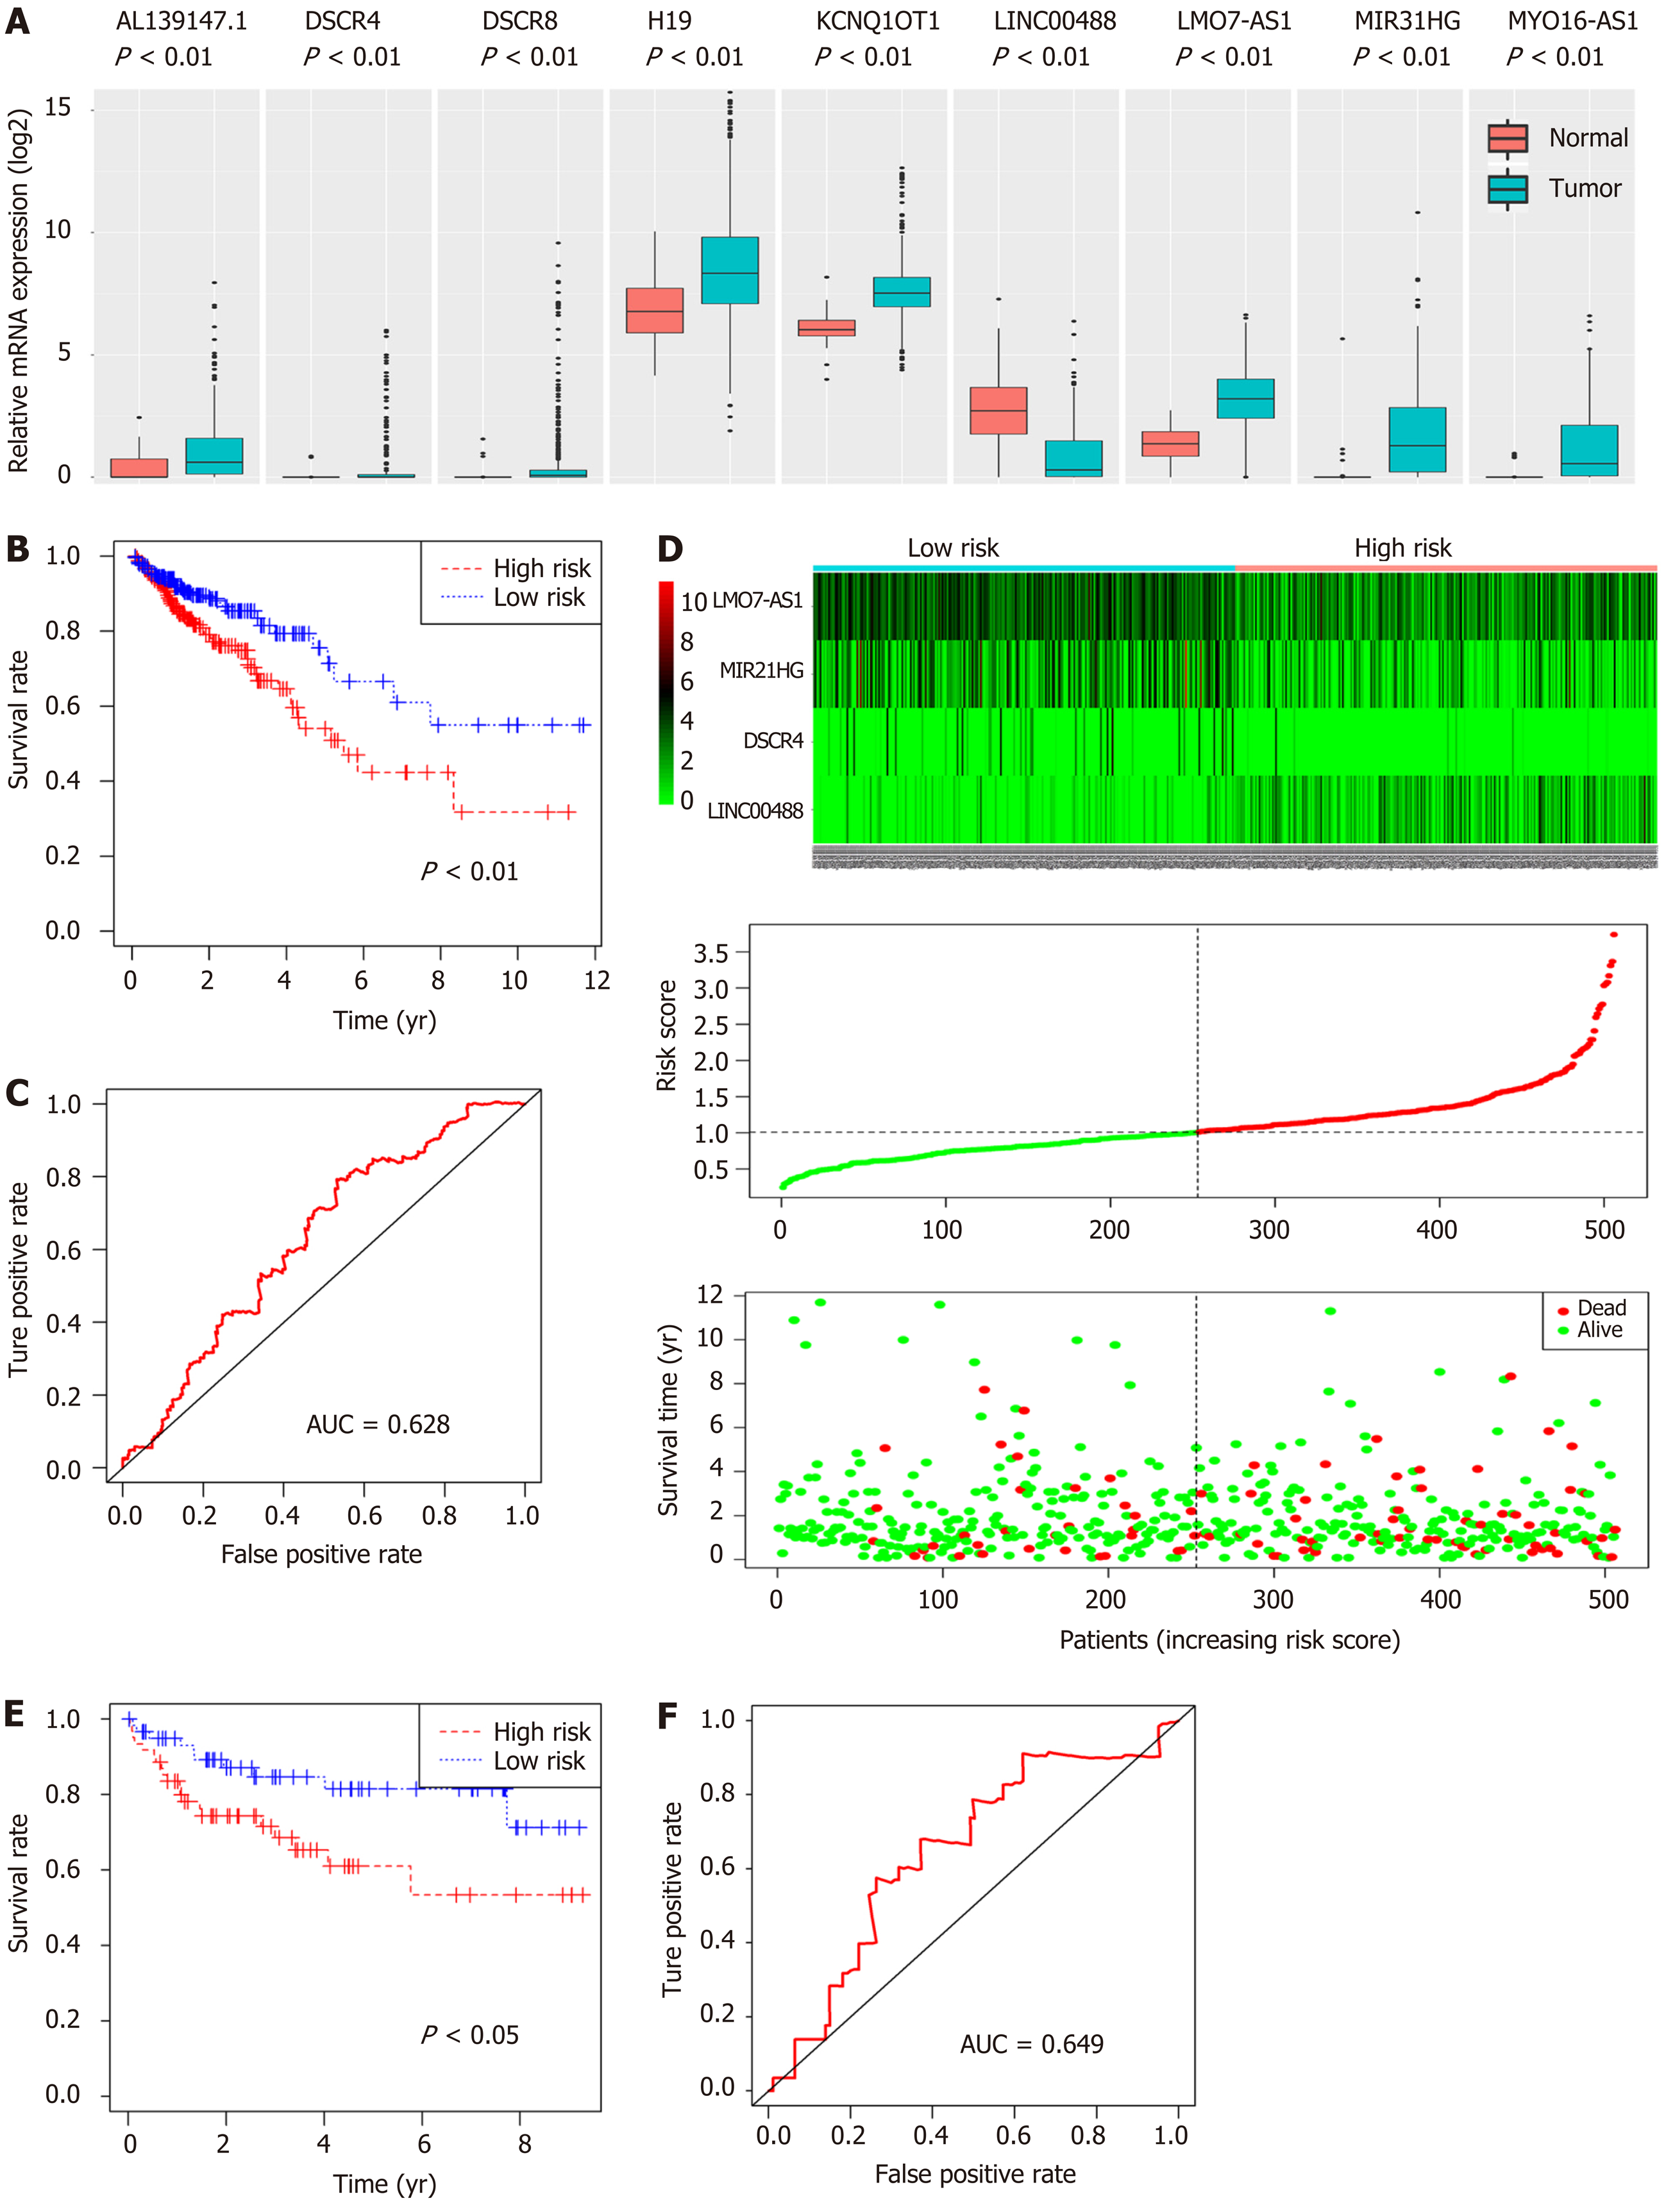
Figure 7 Predictive value assessment of the four-long noncoding RNA model.
A: mRNA expression levels of nine long noncoding RNAs involved in the competing endogenous RNAs network (P < 0.01); B: Kaplan-Meier survival curves of the risk score for high- and low-risk groups (P < 0.01); C: Receiver operating characteristic curve of the risk score predicting 5-year overall survival (P < 0.01); D: The heatmap, distribution of risk score, and patient status for the four-long noncoding RNA expression profiles between high- and low-risk groups; E: Kaplan-Meier survival curves of the risk score based on GSE38832 (P < 0.05); F: Receiver operating characteristic curve of the risk score for predicting 5-year overall survival based on GSE38832 (P < 0.05).
- Citation: Yang ZD, Kang H. Exploring prognostic potential of long noncoding RNAs in colorectal cancer based on a competing endogenous RNA network. World J Gastroenterol 2020; 26(12): 1298-1316
- URL: https://www.wjgnet.com/1007-9327/full/v26/i12/1298.htm
- DOI: https://dx.doi.org/10.3748/wjg.v26.i12.1298


