Copyright
©The Author(s) 2020.
World J Gastroenterol. Mar 21, 2020; 26(11): 1208-1220
Published online Mar 21, 2020. doi: 10.3748/wjg.v26.i11.1208
Published online Mar 21, 2020. doi: 10.3748/wjg.v26.i11.1208
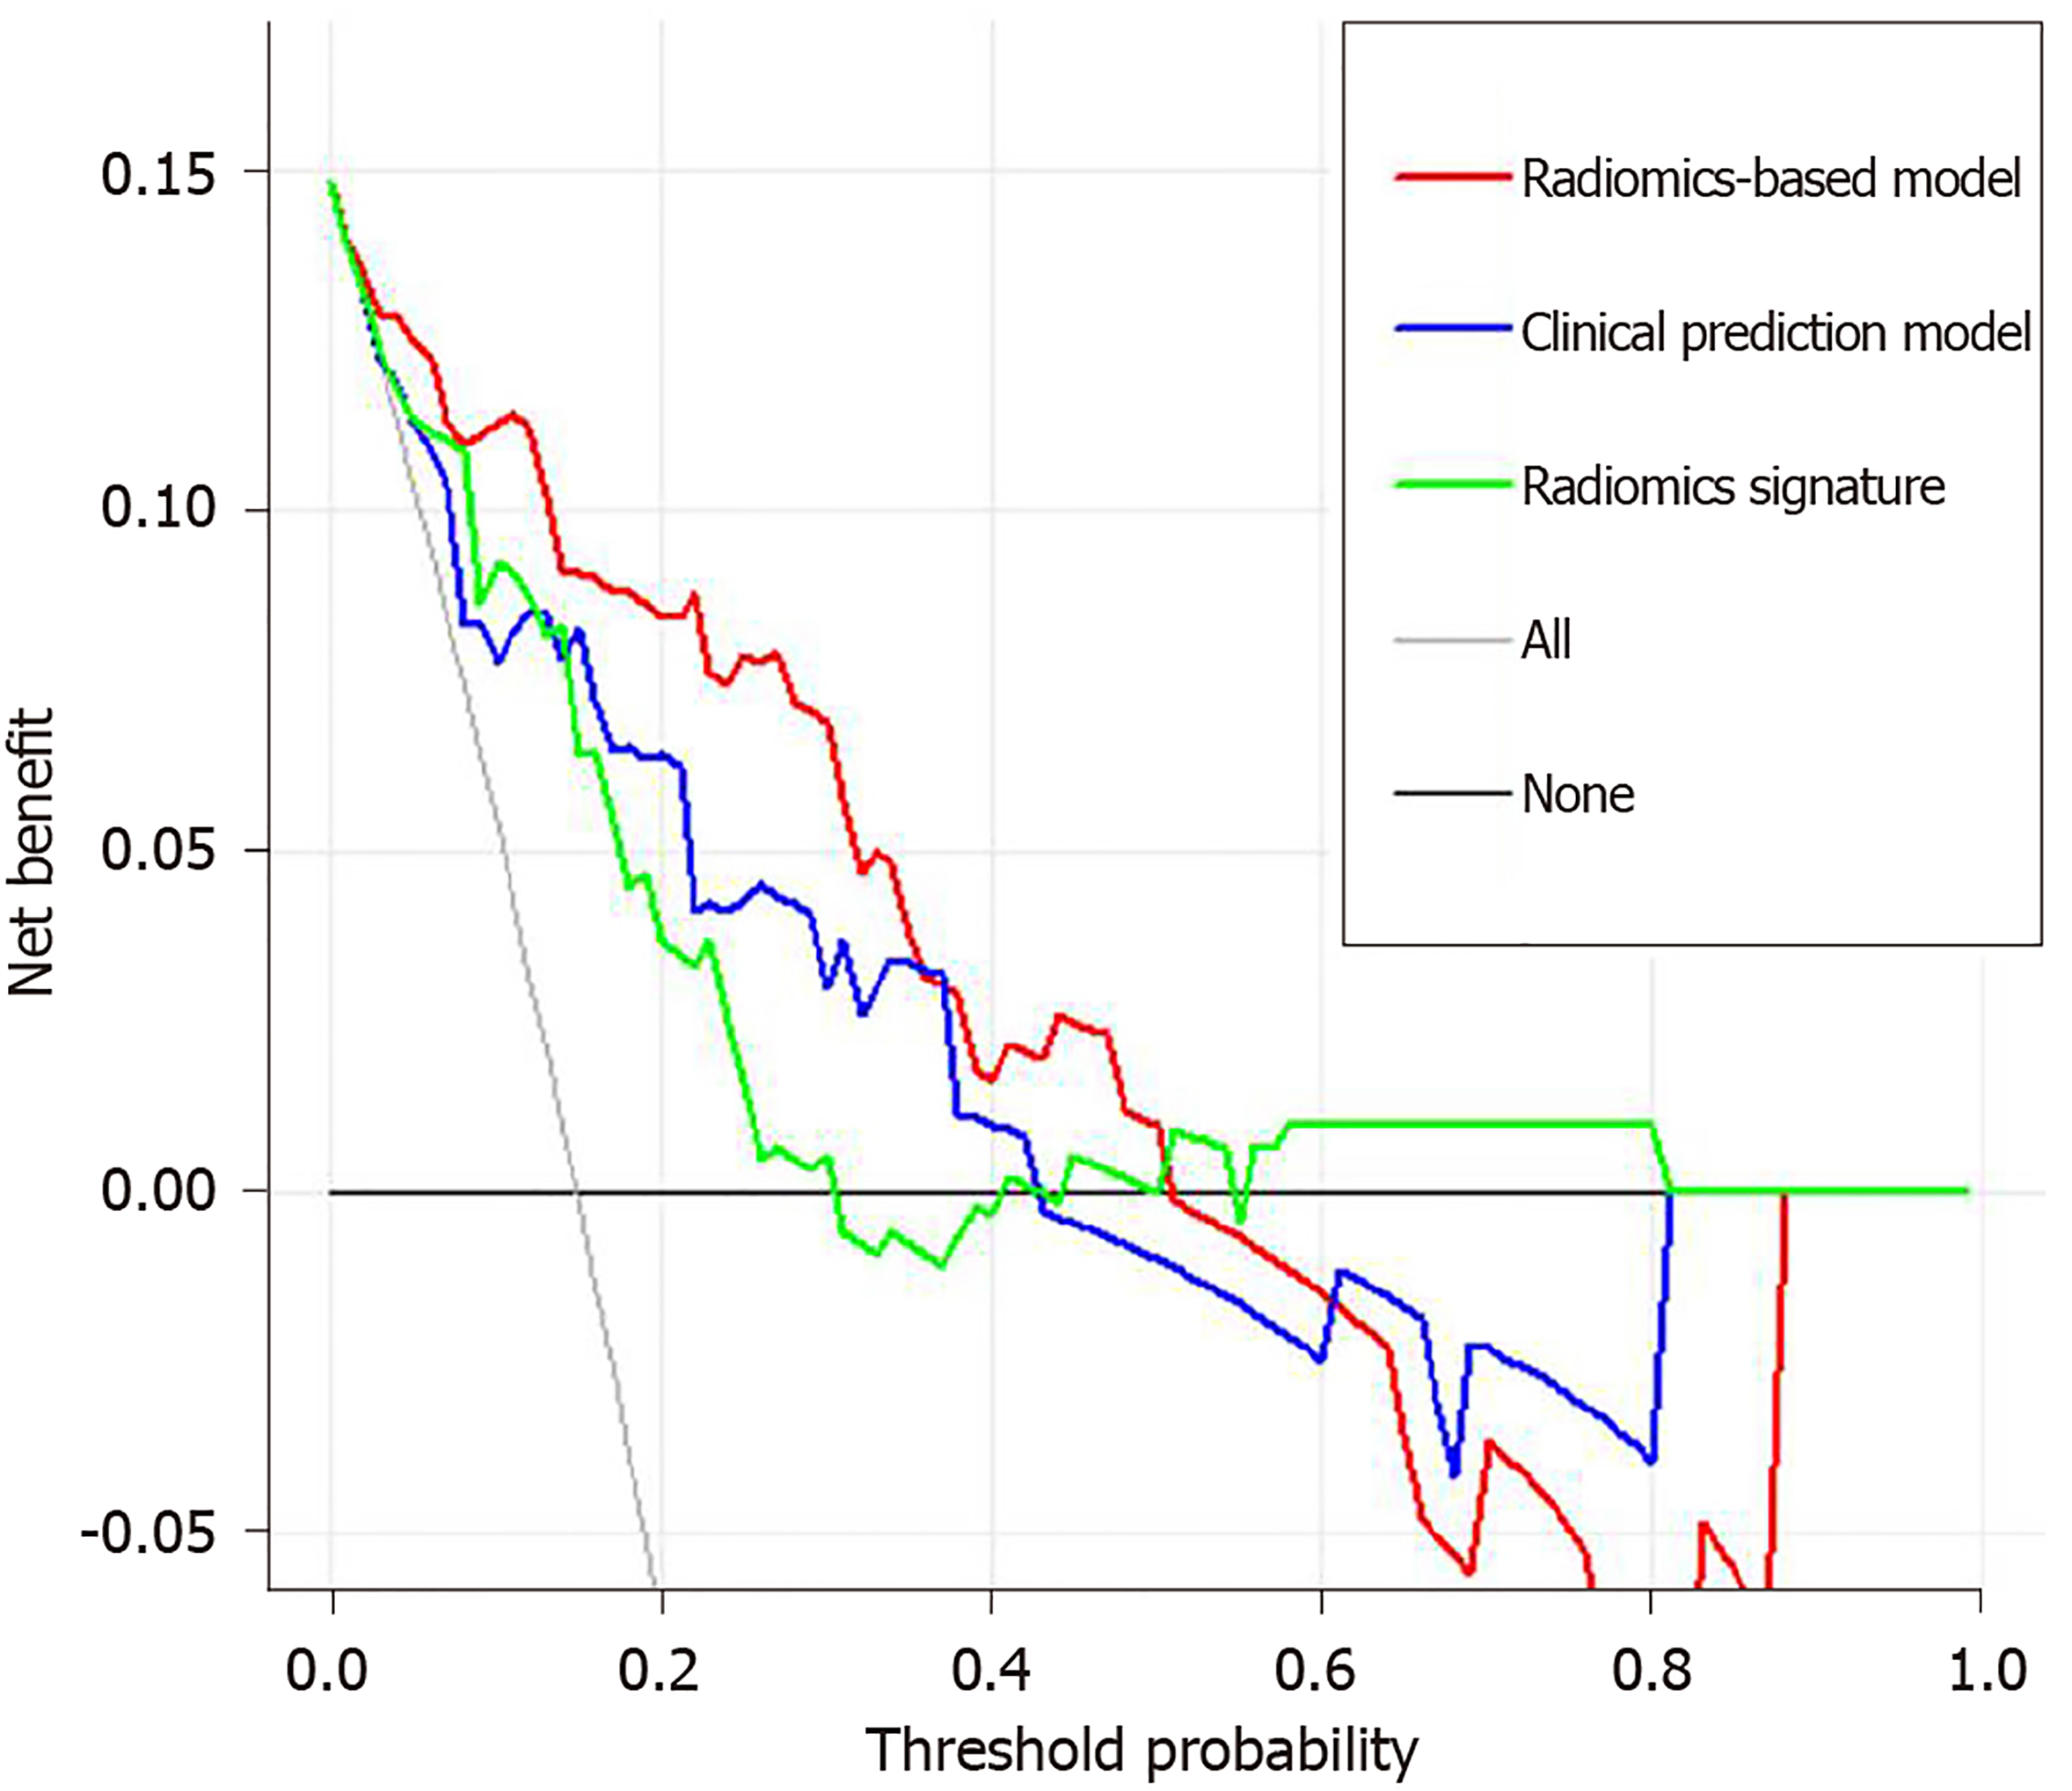
Figure 5 Decision curve analysis for each model.
The y-axis measures the net benefit, which is calculated by summing the benefits (true-positive findings) and subtracting the harms (false-positive findings), weighting the latter by a factor related to the relative harm of undetected liver failure compared with the harm of unnecessary treatment. The decision curve showed the application of radiomics-based model to predict liver failure adds more benefit than treating all or none of the patients, clinical prediction model, and radiomics signature.
- Citation: Zhu WS, Shi SY, Yang ZH, Song C, Shen J. Radiomics model based on preoperative gadoxetic acid-enhanced MRI for predicting liver failure. World J Gastroenterol 2020; 26(11): 1208-1220
- URL: https://www.wjgnet.com/1007-9327/full/v26/i11/1208.htm
- DOI: https://dx.doi.org/10.3748/wjg.v26.i11.1208


