Copyright
©The Author(s) 2020.
World J Gastroenterol. Mar 14, 2020; 26(10): 1067-1079
Published online Mar 14, 2020. doi: 10.3748/wjg.v26.i10.1067
Published online Mar 14, 2020. doi: 10.3748/wjg.v26.i10.1067
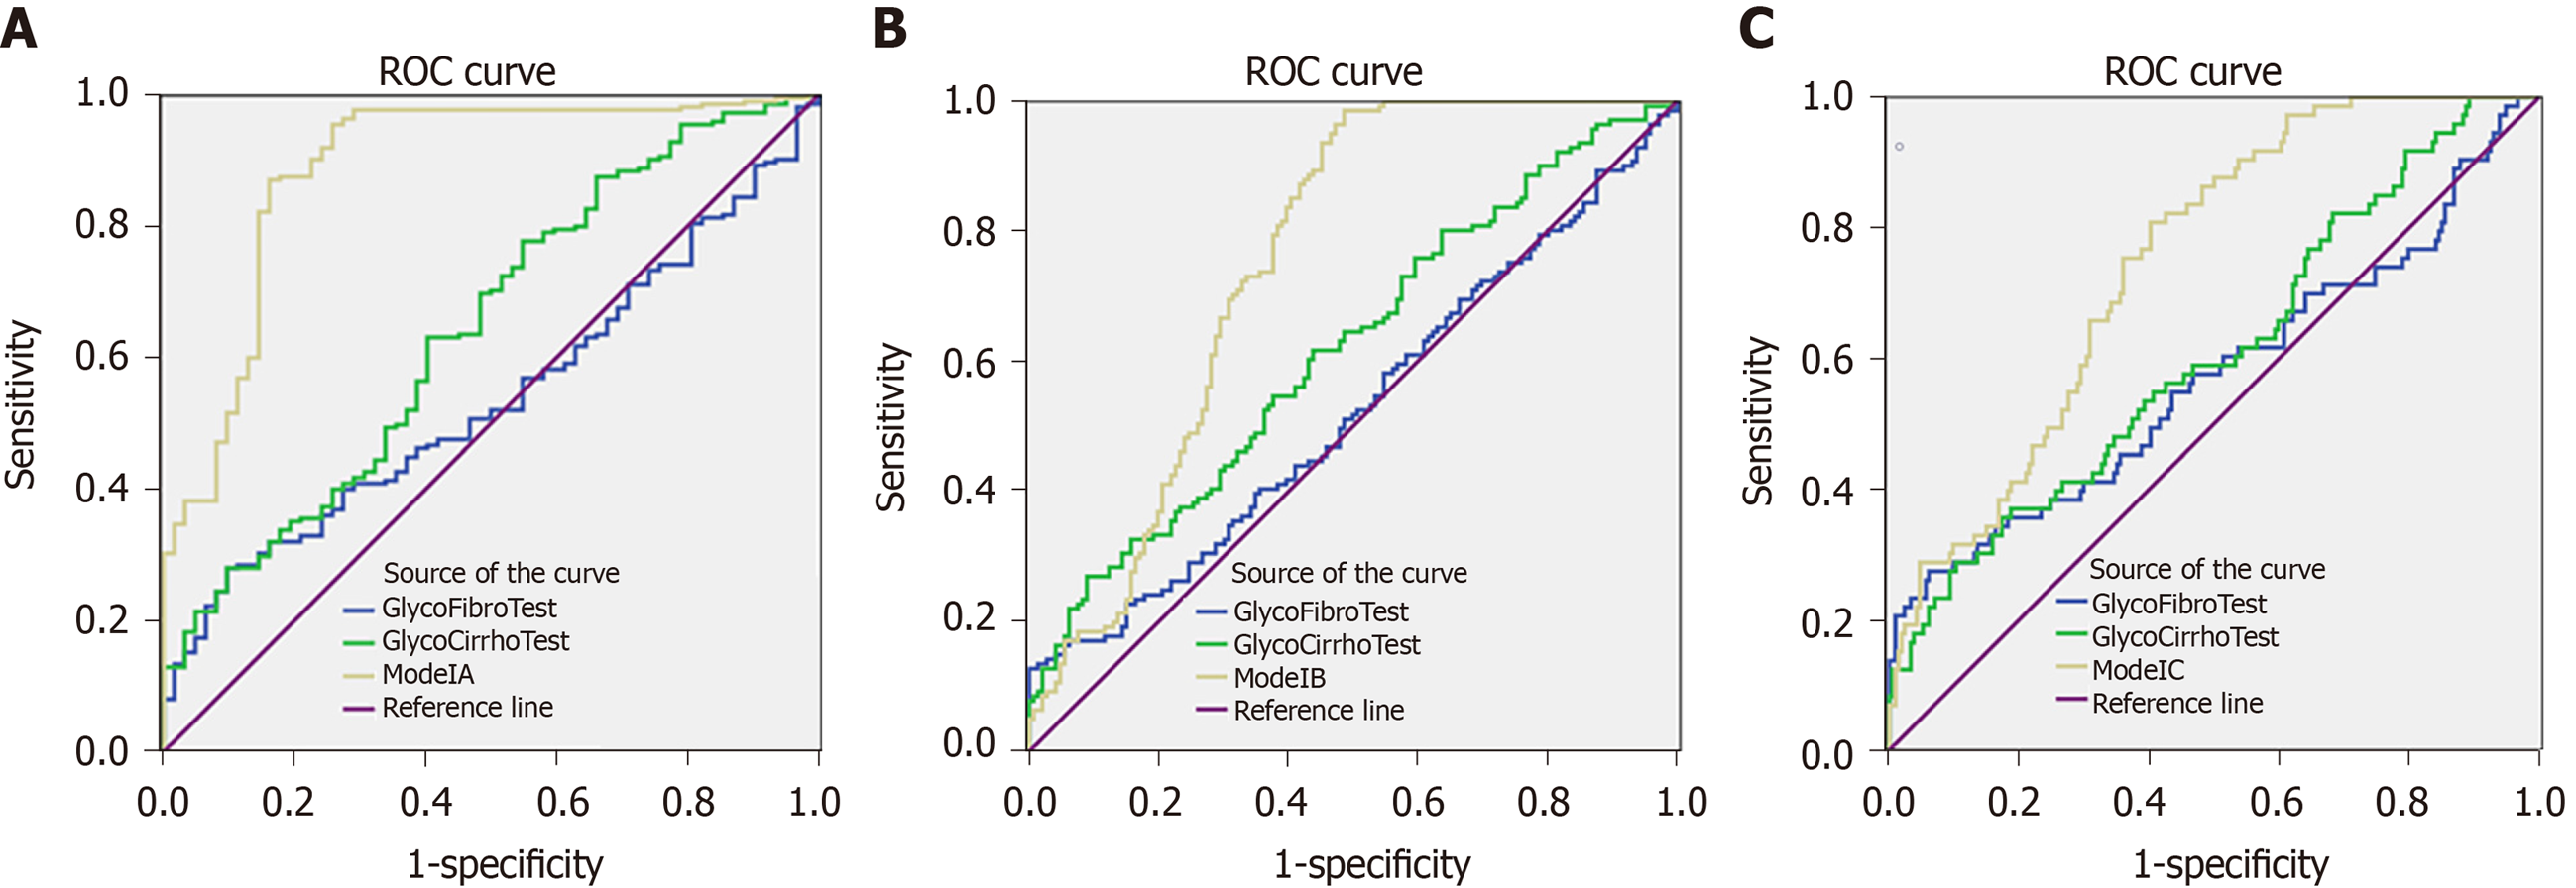
Figure 2 Receiver operating characteristic curve.
A: Receiver operating characteristic (ROC) curve for the prediction of fibrosis F0-F1 from fibrosis F2-F4 in the modeling group. [area under ROC curves (AUROCs): Model A (0.890) > GlycoCirrhoTest (0.644) > GlycoFibroTest (0.538)]; B: ROC curve for the prediction of fibrosis F0-F2 from fibrosis F3-F4. [AUROCs: Model B (0.752) > GlycoCirrhoTest (0.618) > GlycoFibroTest (0.524)]; C: ROC curve for the prediction of fibrosis F0-F3 from fibrosis F4. [AUROCs: Model C (0.747) > GlycoCirrhoTest (0.607) > GlycoFibroTest (0.571)].
- Citation: Cao X, Shang QH, Chi XL, Zhang W, Xiao HM, Sun MM, Chen G, An Y, Lv CL, Wang L, Nan YM, Chen CY, Tan ZN, Liu XE, Zhuang H. Serum N-glycan markers for diagnosing liver fibrosis induced by hepatitis B virus. World J Gastroenterol 2020; 26(10): 1067-1079
- URL: https://www.wjgnet.com/1007-9327/full/v26/i10/1067.htm
- DOI: https://dx.doi.org/10.3748/wjg.v26.i10.1067


