Copyright
©The Author(s) 2019.
World J Gastroenterol. Mar 7, 2019; 25(9): 1100-1115
Published online Mar 7, 2019. doi: 10.3748/wjg.v25.i9.1100
Published online Mar 7, 2019. doi: 10.3748/wjg.v25.i9.1100
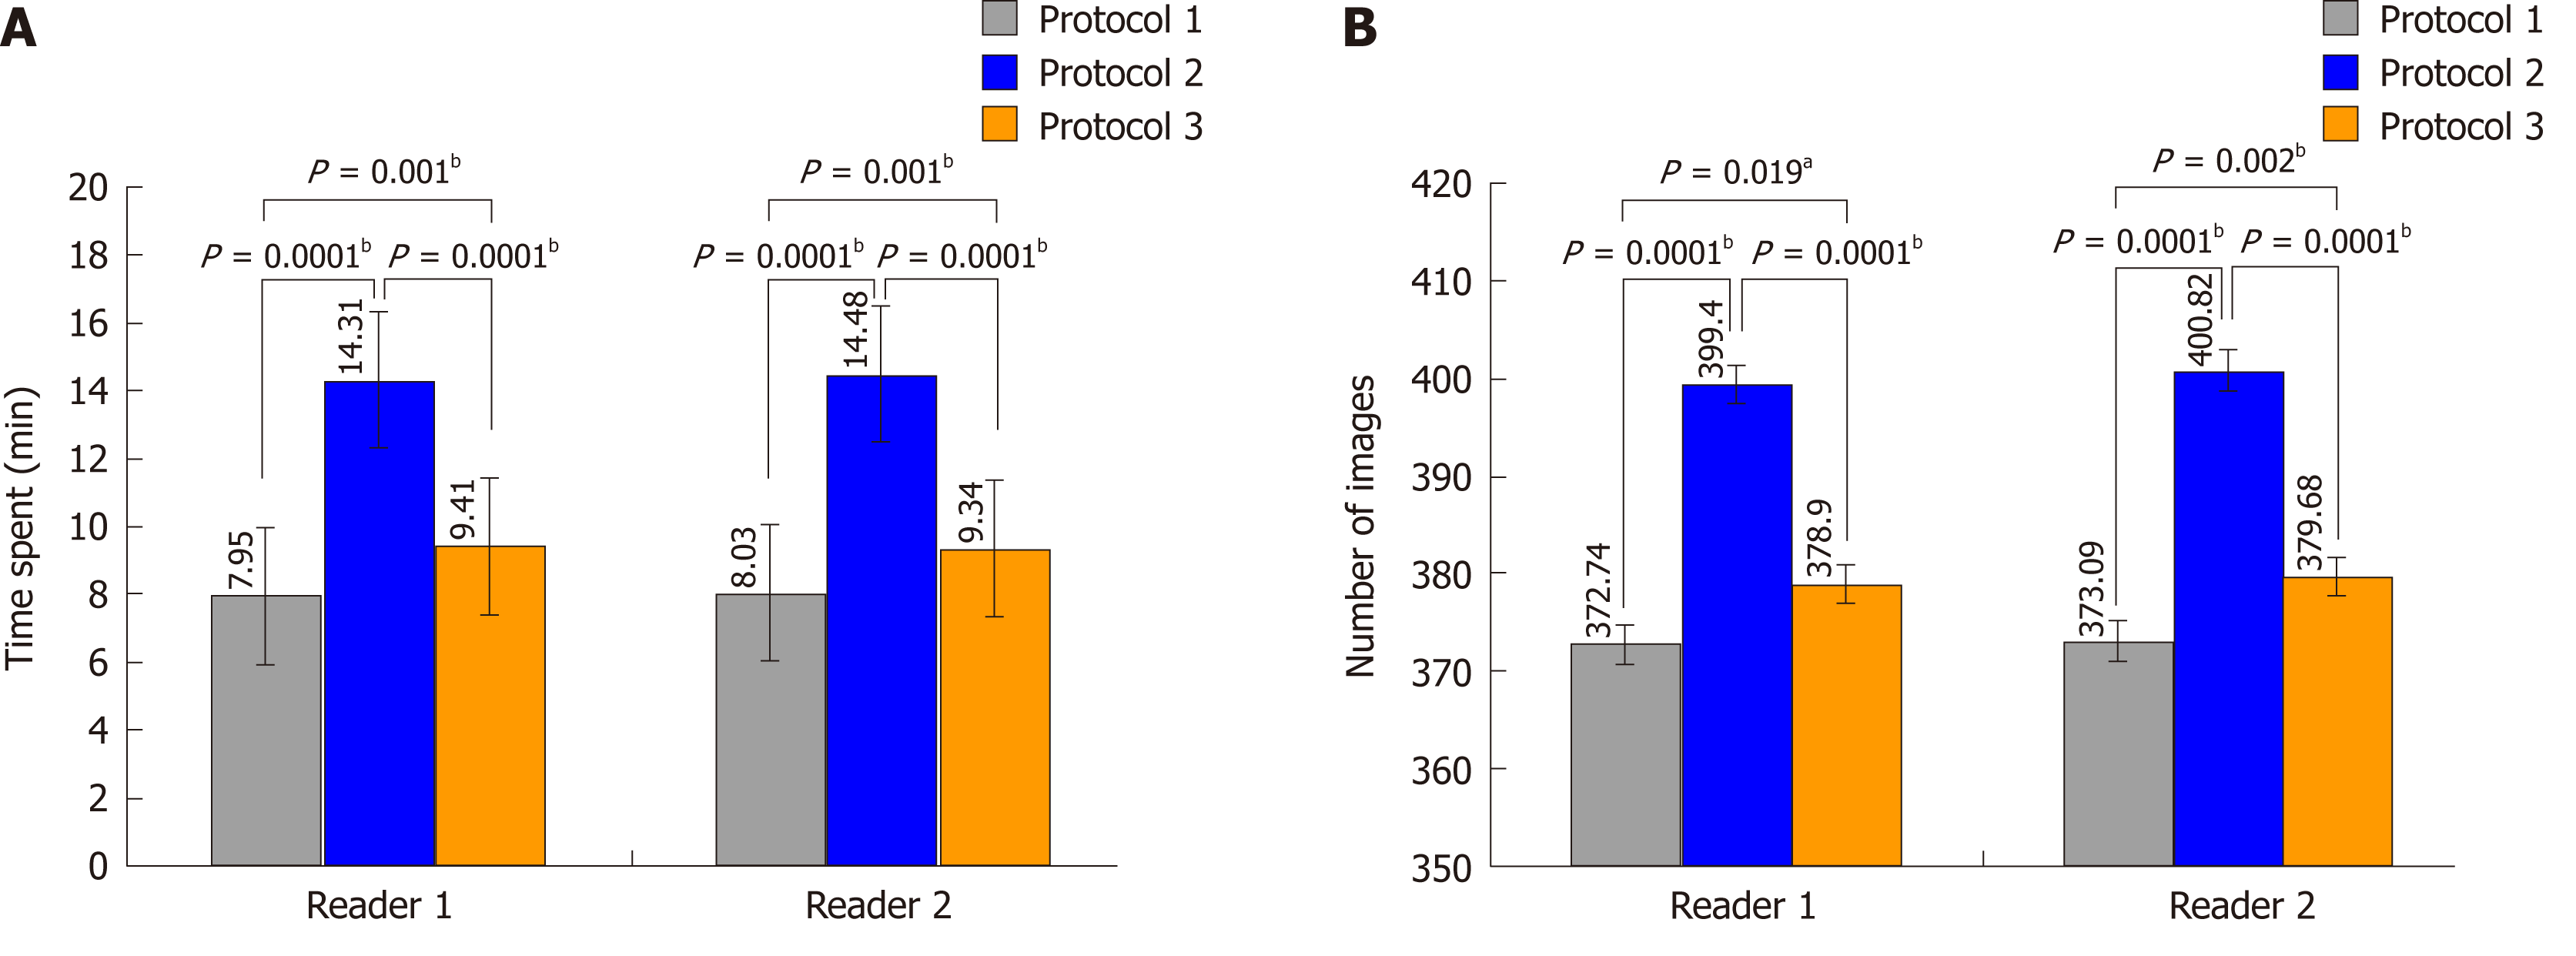
Figure 5 Graphs showing (A) time spent and (B) number of images used for three protocols for disease assessment in patients with clinically suspected small bowel obstruction.
Student’s t test and one-way analysis of variance were used to compare the mean of each result in both the inter and intrareader data sets. aP < 0.05, bP < 0.01.
- Citation: Kuang LQ, Tang W, Li R, Cheng C, Tang SY, Wang Y. Optimized protocol of multiple post-processing techniques improves diagnostic accuracy of multidetector computed tomography in assessment of small bowel obstruction compared with conventional axial and coronal reformations. World J Gastroenterol 2019; 25(9): 1100-1115
- URL: https://www.wjgnet.com/1007-9327/full/v25/i9/1100.htm
- DOI: https://dx.doi.org/10.3748/wjg.v25.i9.1100


