Copyright
©The Author(s) 2019.
World J Gastroenterol. Feb 28, 2019; 25(8): 955-966
Published online Feb 28, 2019. doi: 10.3748/wjg.v25.i8.955
Published online Feb 28, 2019. doi: 10.3748/wjg.v25.i8.955
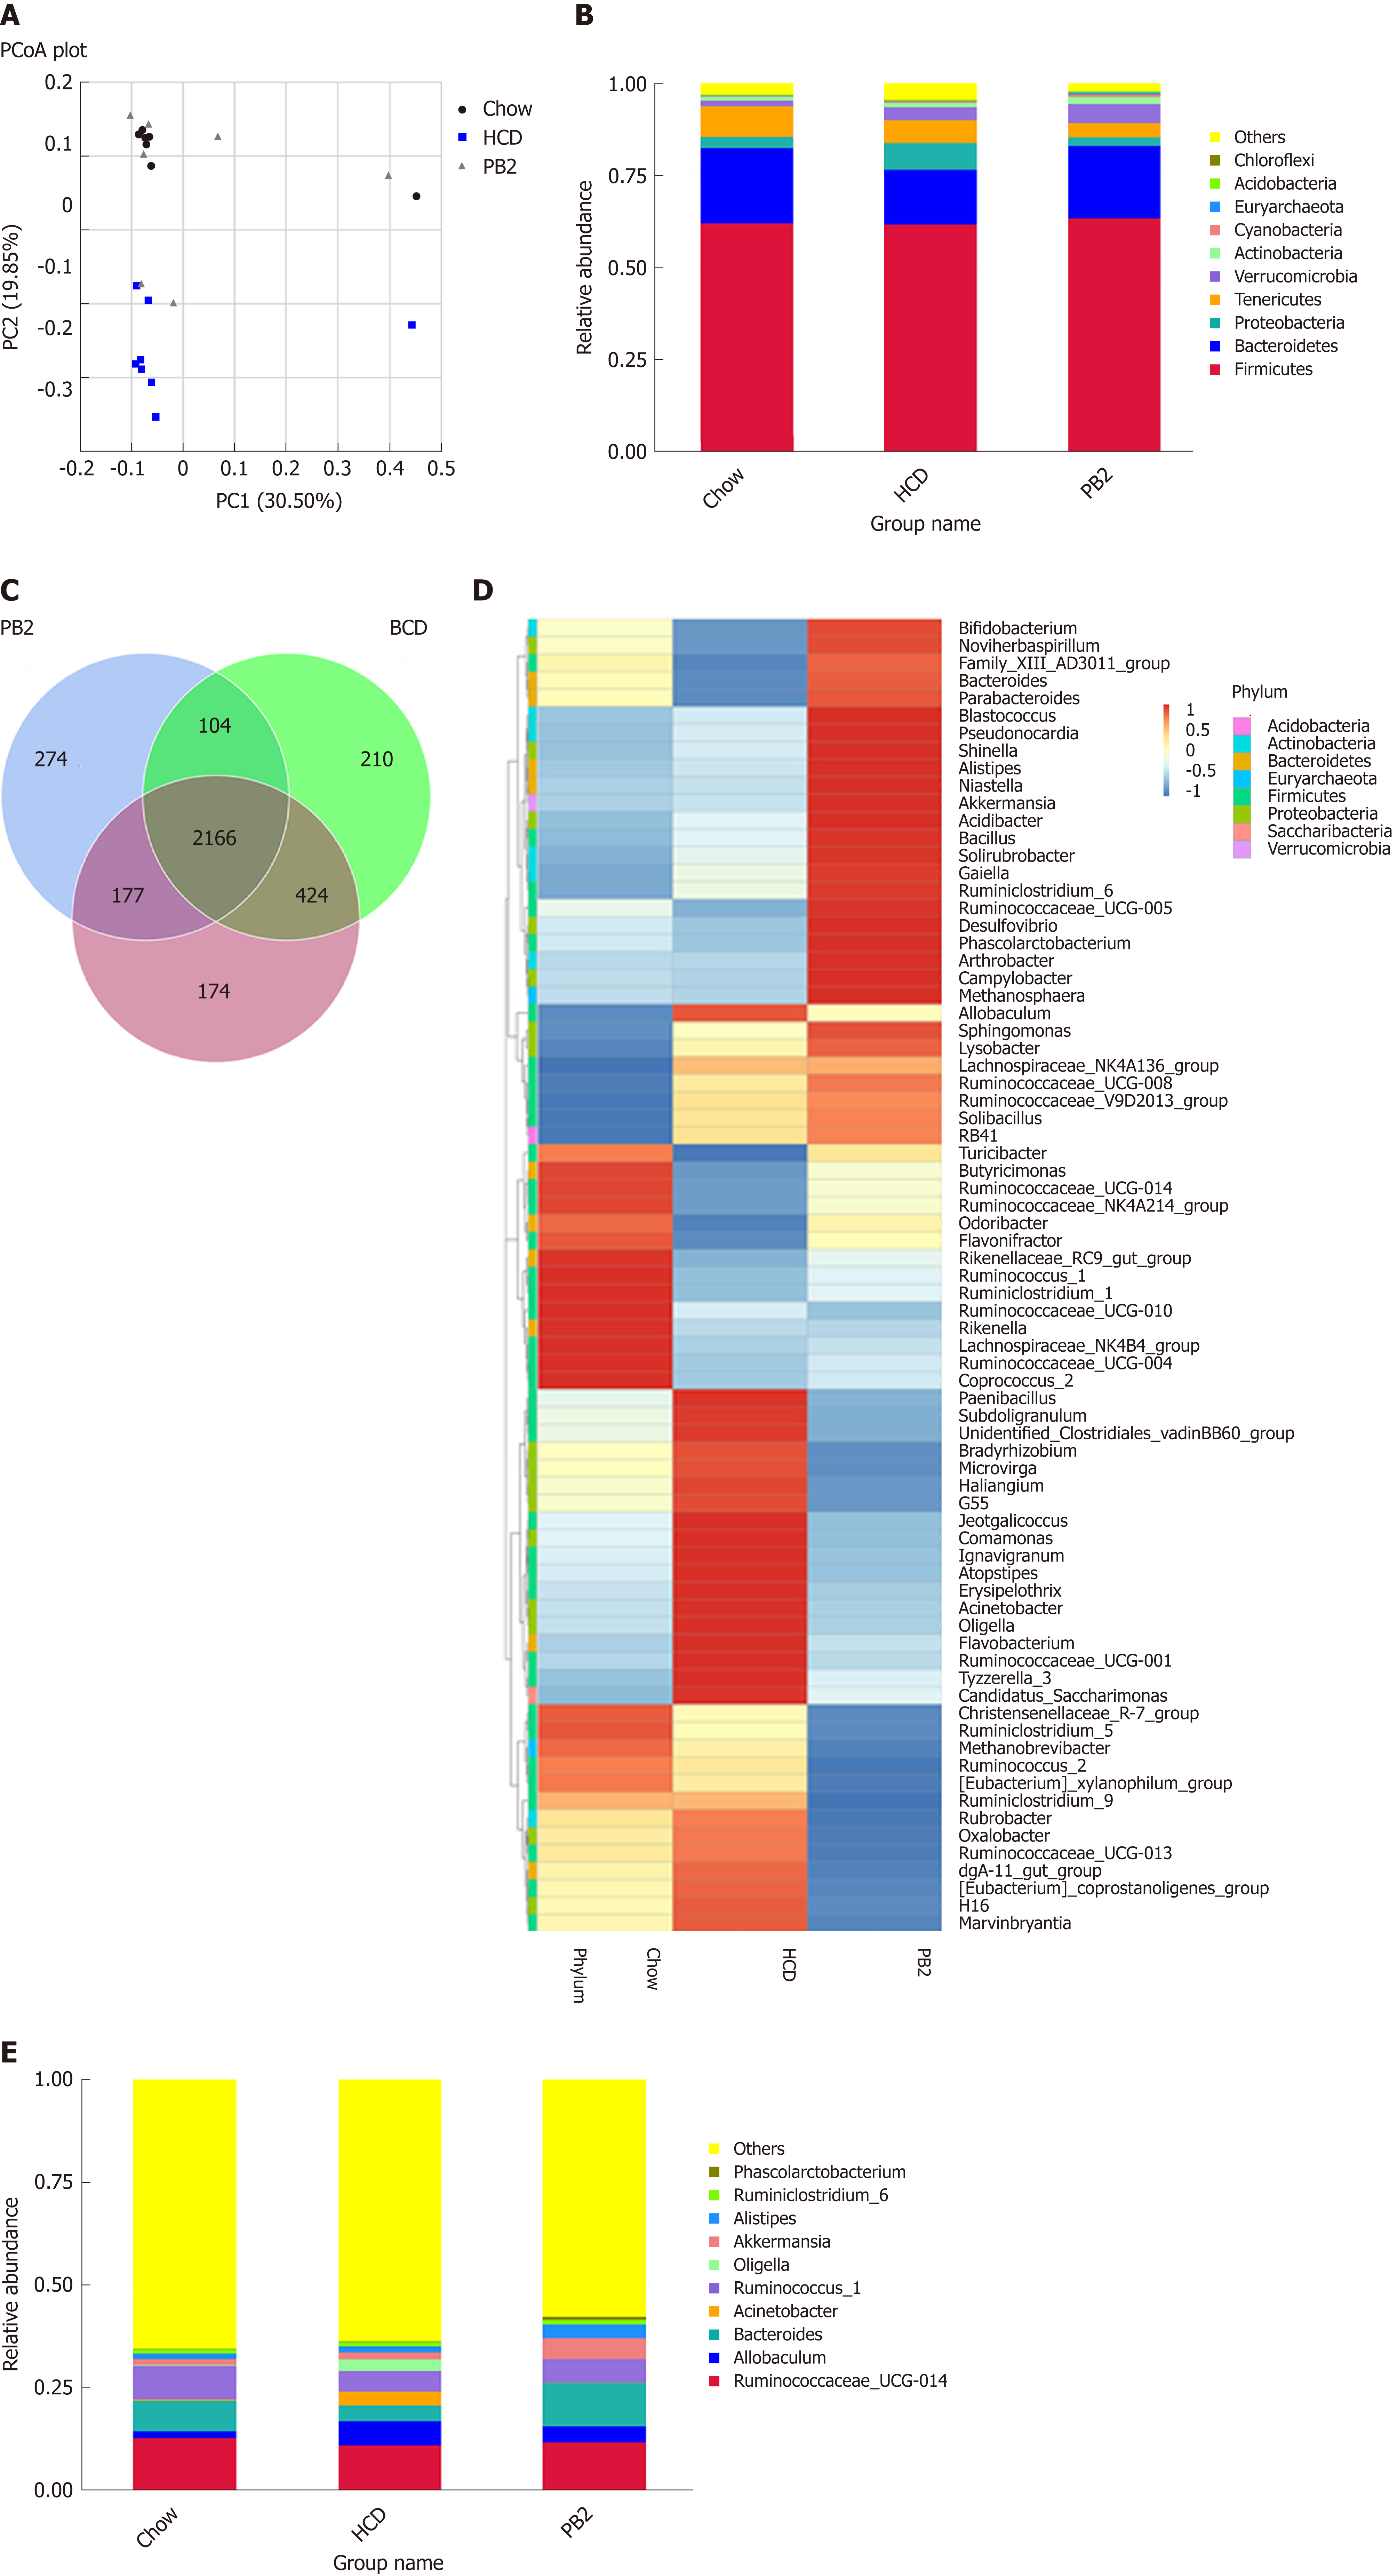
Figure 4 Effects of procyanidin B2 on gut microbiota.
A: Principal coordinate analysis of the gut microbiota based on unweighted UniFrac distances between groups; B: Relative abundance of gut microbiota in phylum; C: Venn diagrams described the number of operational taxonomic units that are distinct and shared across the groups; D: Heatmap: Community hierarchical clustering analysis of major taxonomic groups at genus level, the red represents high relative abundance and the blue represent low relative abundance; E: Relative abundance of gut microbiota in genus. HCD: High-fat-cholesterol diet; PB2: Procyanidin B2; PCoA: Principal coordinate analysis; OTUs: Operational taxonomic units.
- Citation: Xing YW, Lei GT, Wu QH, Jiang Y, Huang MX. Procyanidin B2 protects against diet-induced obesity and non-alcoholic fatty liver disease via the modulation of the gut microbiota in rabbits. World J Gastroenterol 2019; 25(8): 955-966
- URL: https://www.wjgnet.com/1007-9327/full/v25/i8/955.htm
- DOI: https://dx.doi.org/10.3748/wjg.v25.i8.955


