Copyright
©The Author(s) 2019.
World J Gastroenterol. Feb 28, 2019; 25(8): 941-954
Published online Feb 28, 2019. doi: 10.3748/wjg.v25.i8.941
Published online Feb 28, 2019. doi: 10.3748/wjg.v25.i8.941
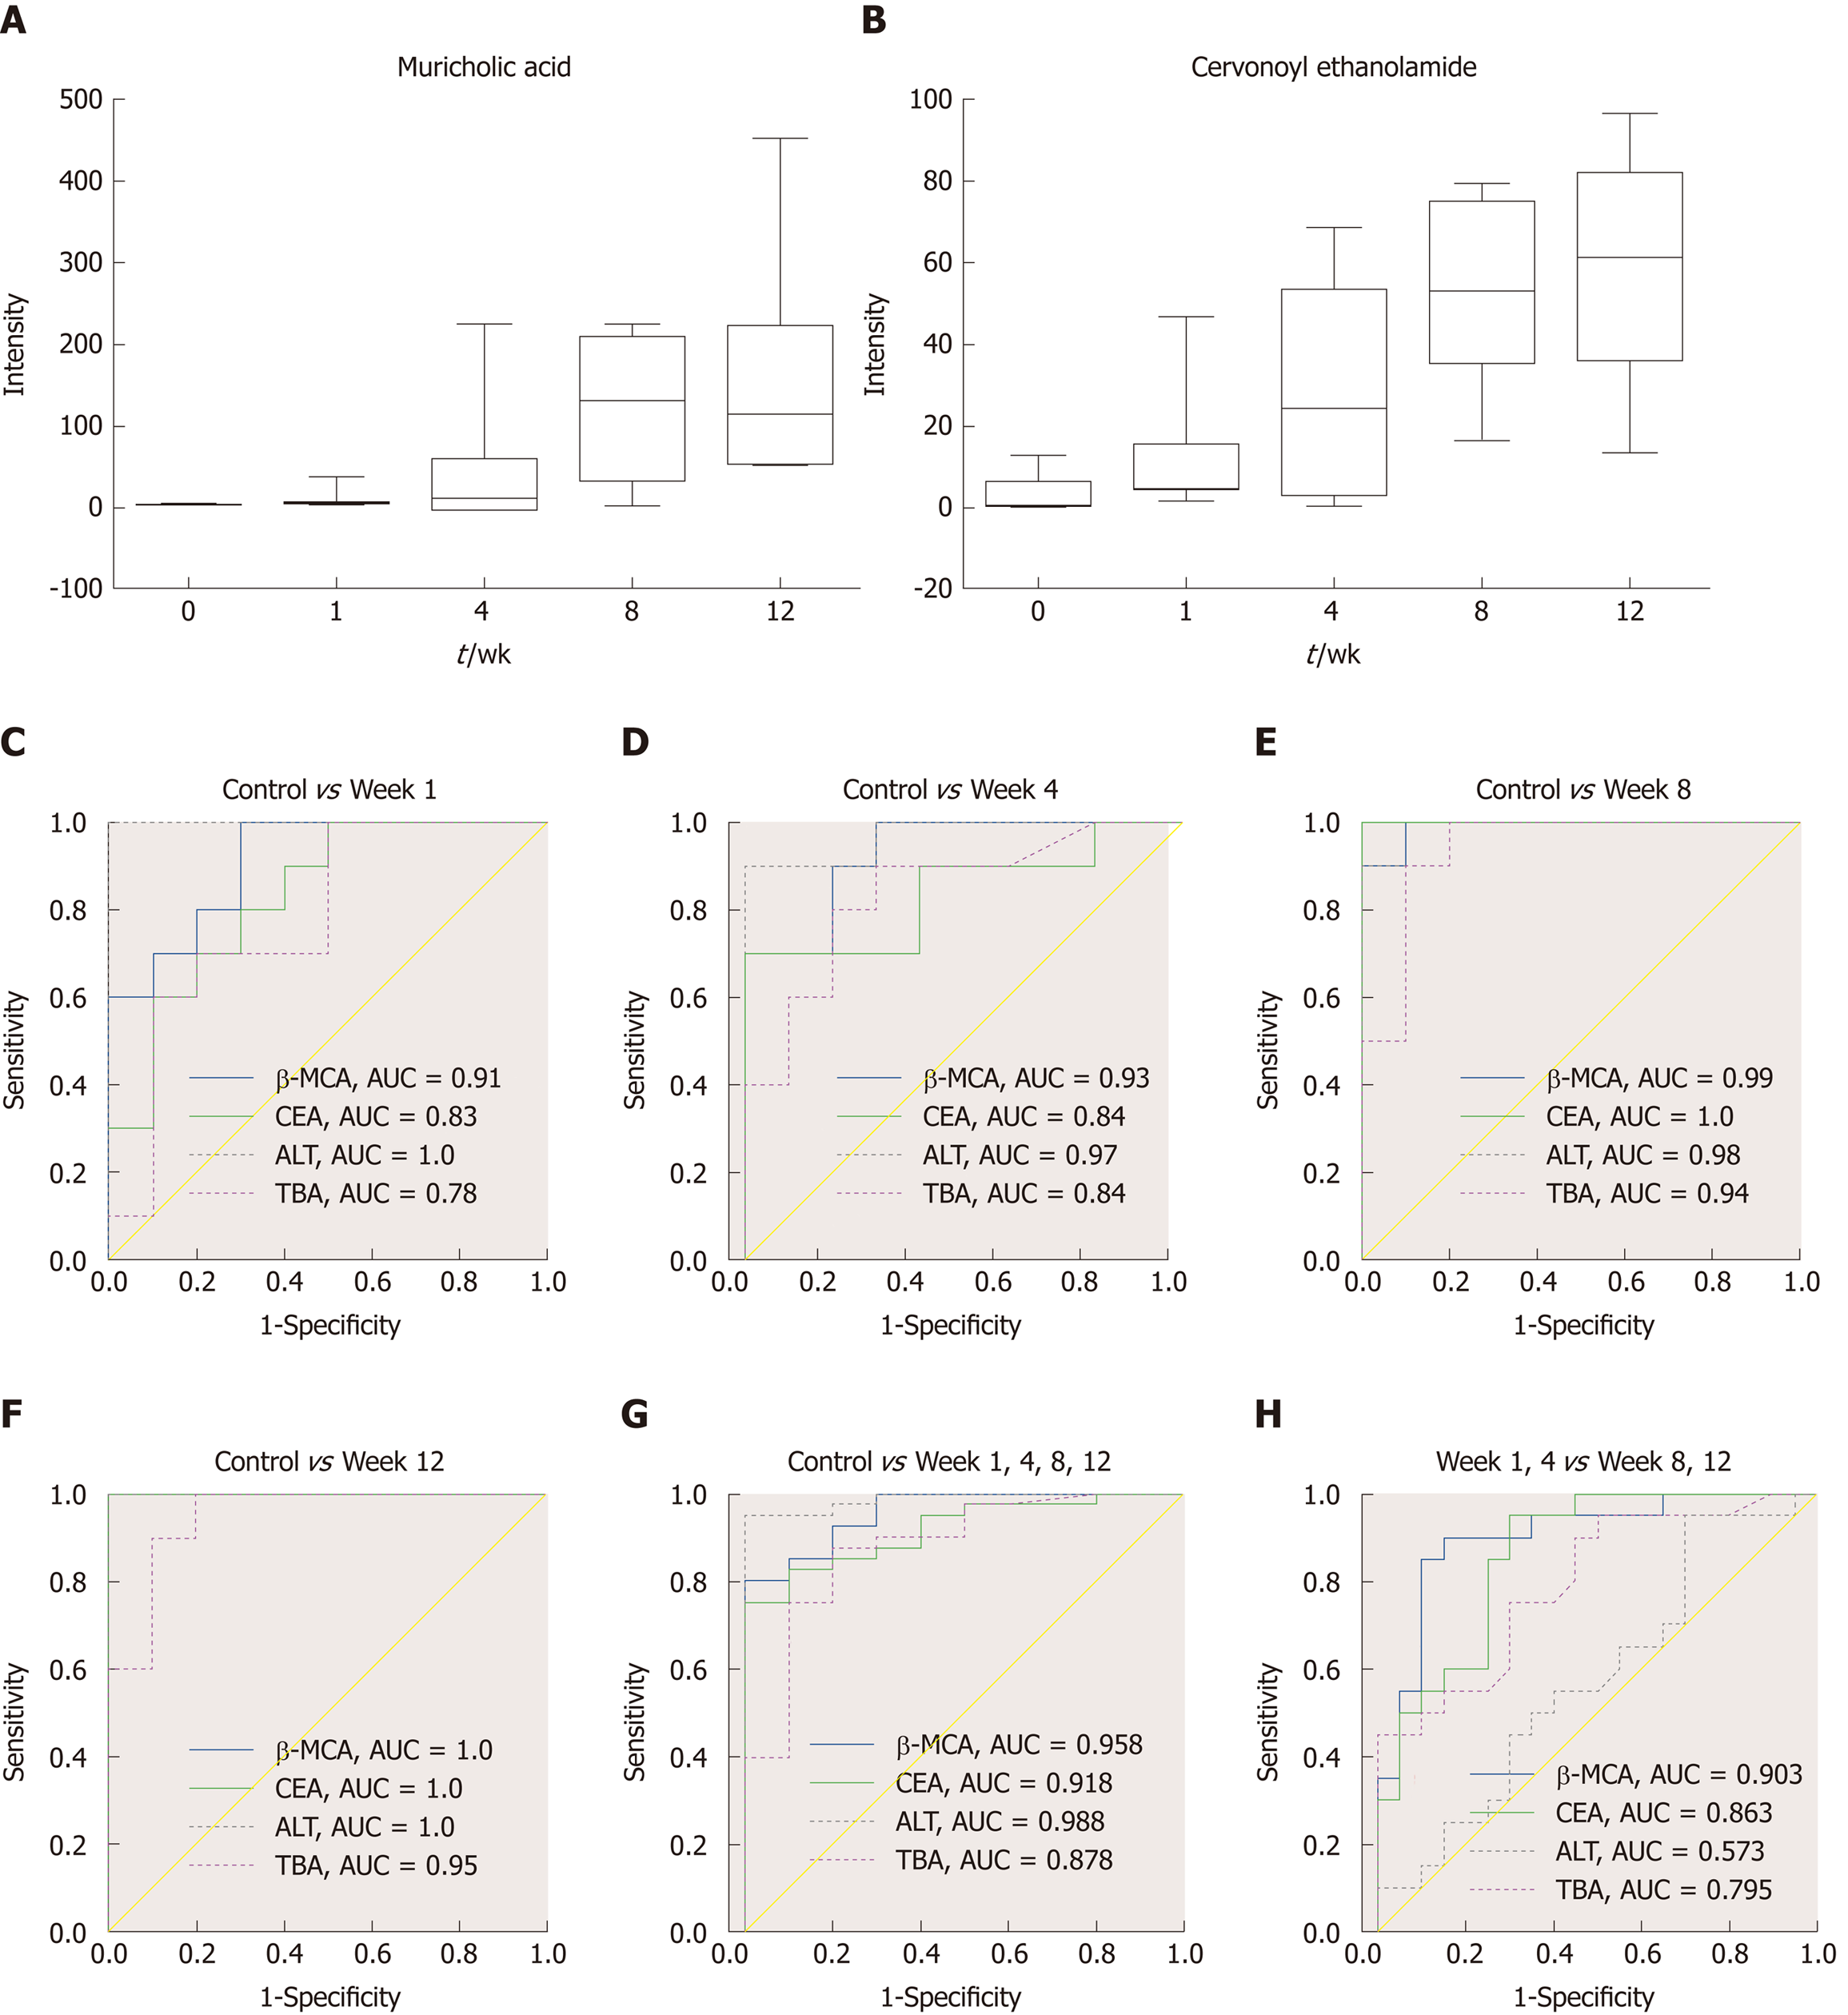
Figure 6 Biomarker candidates for liver fibrosis.
A and B: Dynamic changes in the identified metabolites in each group; C-H: Receiver operator characteristic curves for the diagnosis of liver fibrosis based on the potential biomarkers, TBA and ALT. TBA: Total bile acid; ALT: Alanine aminotransferase; AUC: Area under the curve; CEA: Cervonoyl ethanolamide; β-MCA: β-muricholic acid.
- Citation: Yu J, He JQ, Chen DY, Pan QL, Yang JF, Cao HC, Li LJ. Dynamic changes of key metabolites during liver fibrosis in rats. World J Gastroenterol 2019; 25(8): 941-954
- URL: https://www.wjgnet.com/1007-9327/full/v25/i8/941.htm
- DOI: https://dx.doi.org/10.3748/wjg.v25.i8.941


