Copyright
©The Author(s) 2019.
World J Gastroenterol. Feb 28, 2019; 25(8): 941-954
Published online Feb 28, 2019. doi: 10.3748/wjg.v25.i8.941
Published online Feb 28, 2019. doi: 10.3748/wjg.v25.i8.941
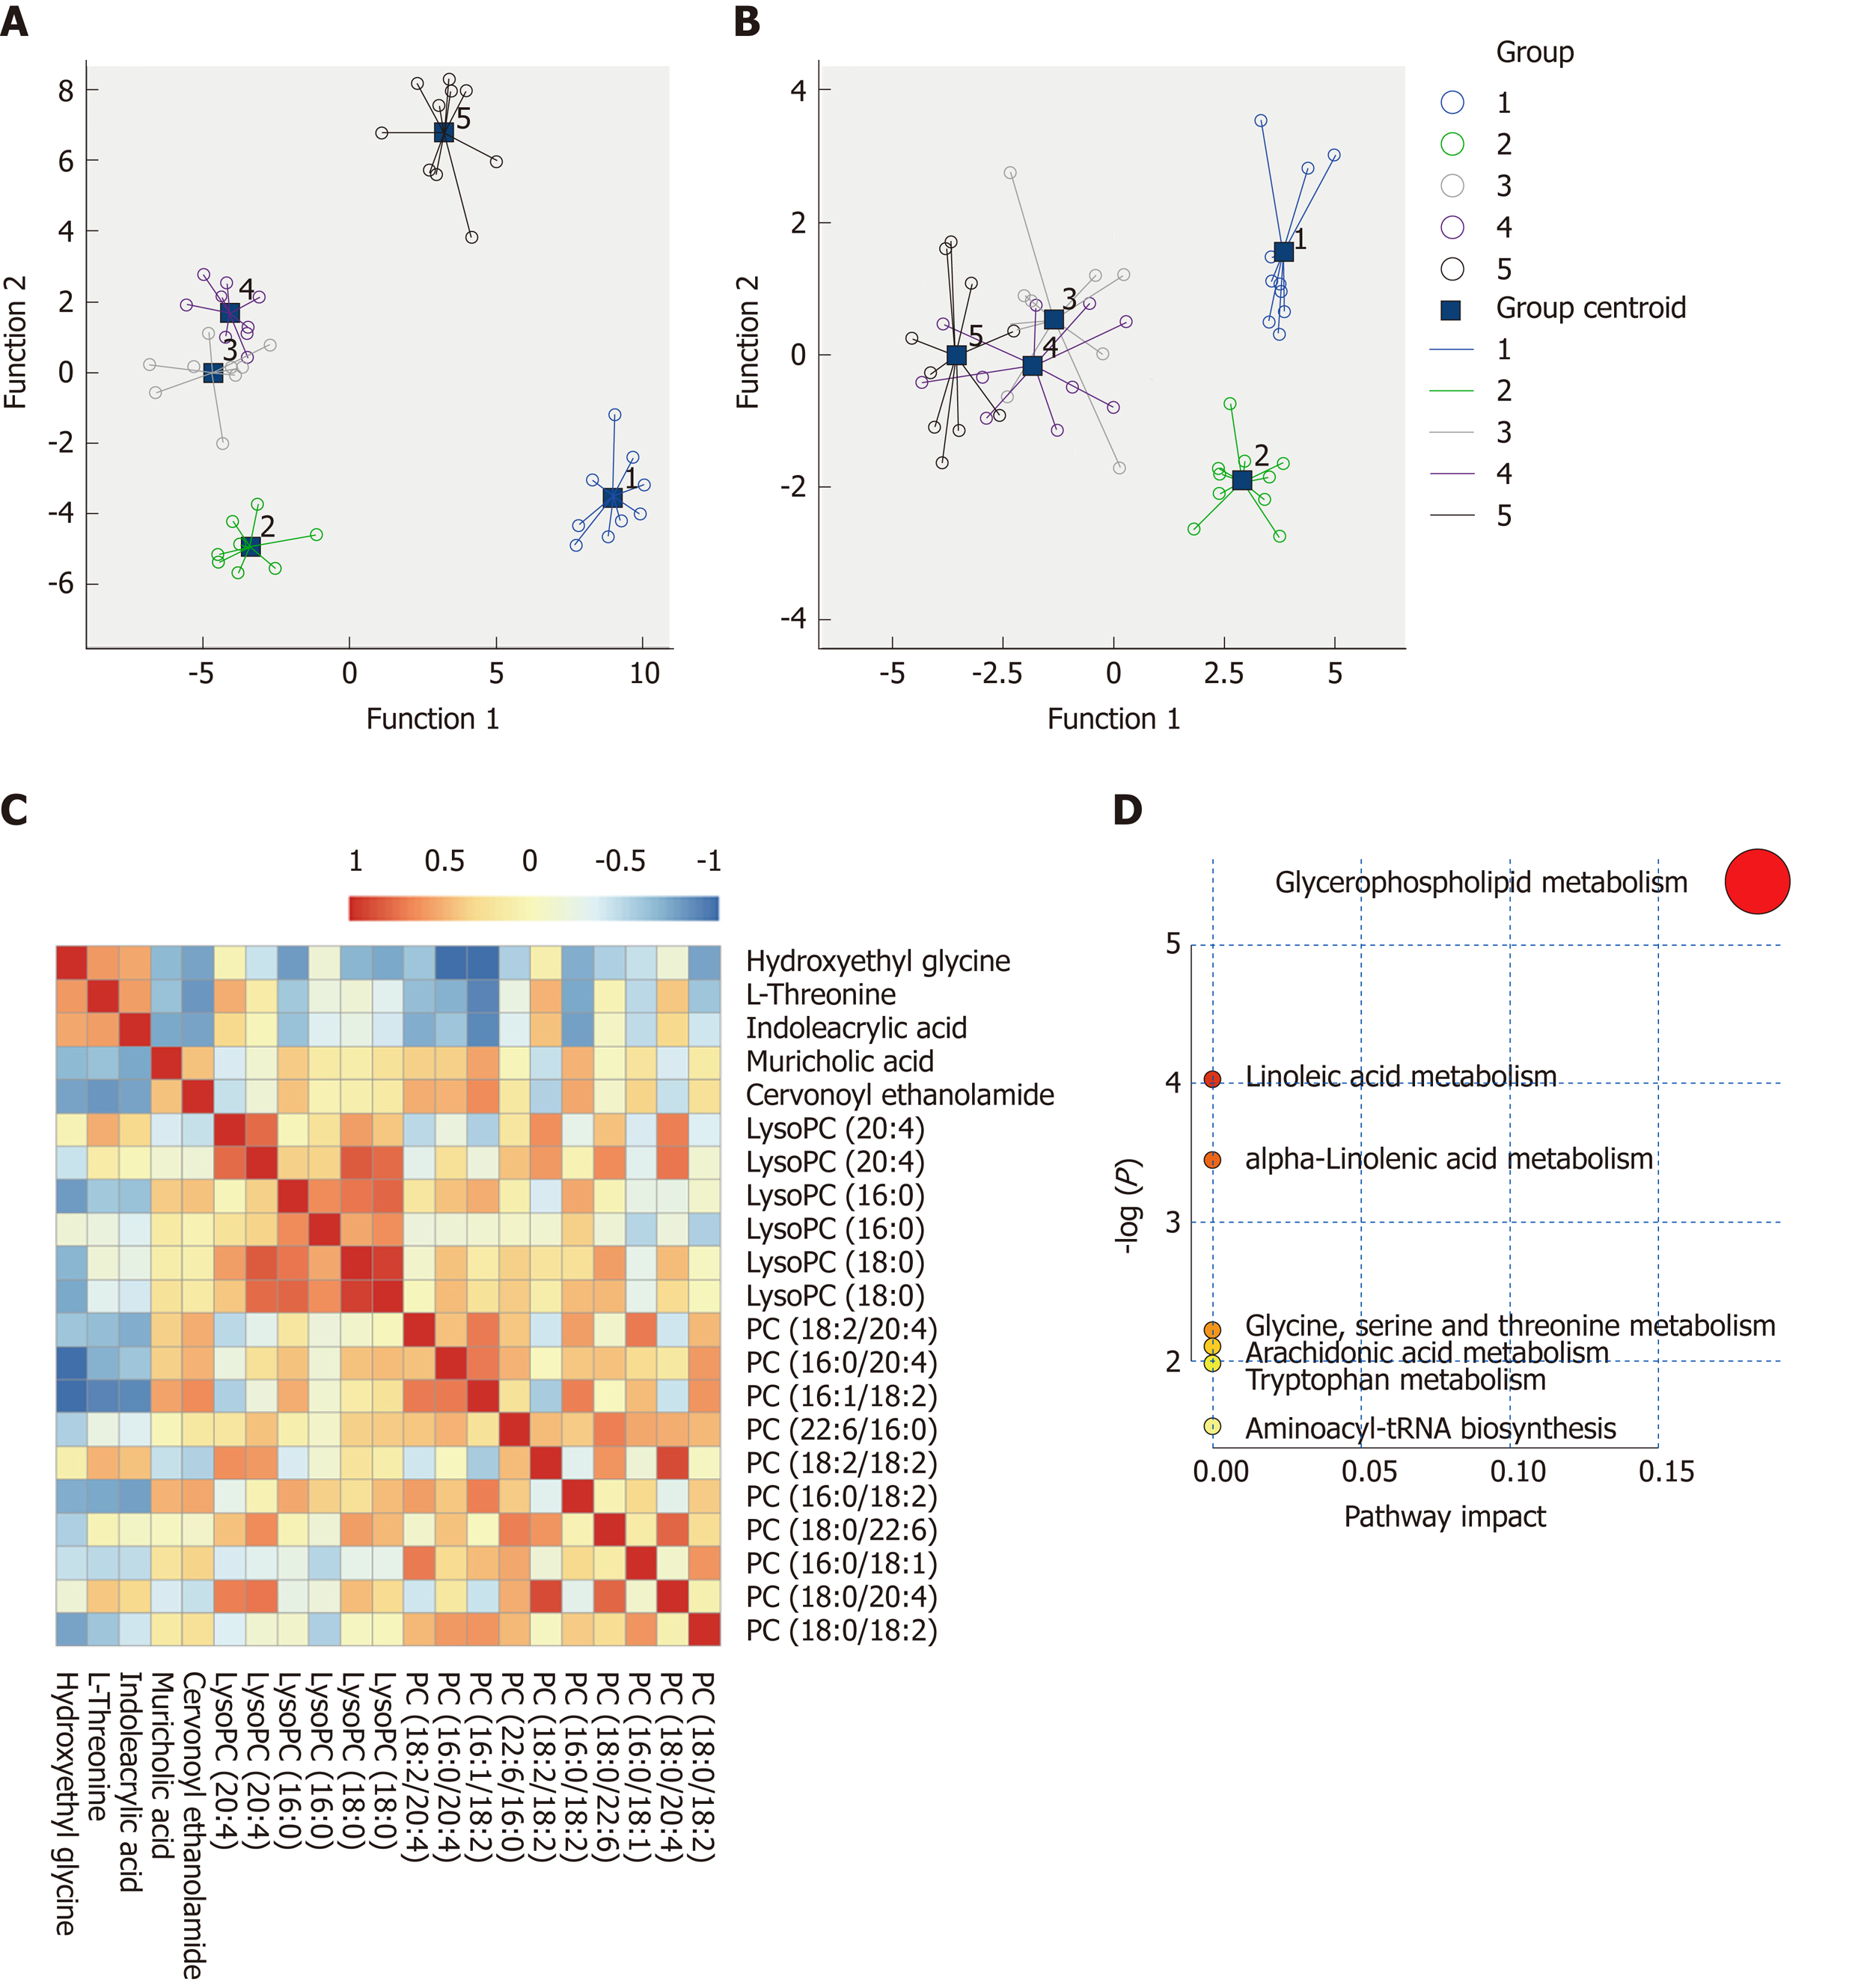
Figure 5 Metabolite quantification and identification.
A and B: Scatter plots of discriminant analyses in five groups based on metabolic profiles and biochemical parameters; C: Correlation analyses of the metabolic profiles. The color saturation of red and blue represents positive and negative correlation coefficients, respectively, between markers; D: Overview of pathway analyses based on selected metabolites.
- Citation: Yu J, He JQ, Chen DY, Pan QL, Yang JF, Cao HC, Li LJ. Dynamic changes of key metabolites during liver fibrosis in rats. World J Gastroenterol 2019; 25(8): 941-954
- URL: https://www.wjgnet.com/1007-9327/full/v25/i8/941.htm
- DOI: https://dx.doi.org/10.3748/wjg.v25.i8.941


