Copyright
©The Author(s) 2019.
World J Gastroenterol. Feb 28, 2019; 25(8): 941-954
Published online Feb 28, 2019. doi: 10.3748/wjg.v25.i8.941
Published online Feb 28, 2019. doi: 10.3748/wjg.v25.i8.941
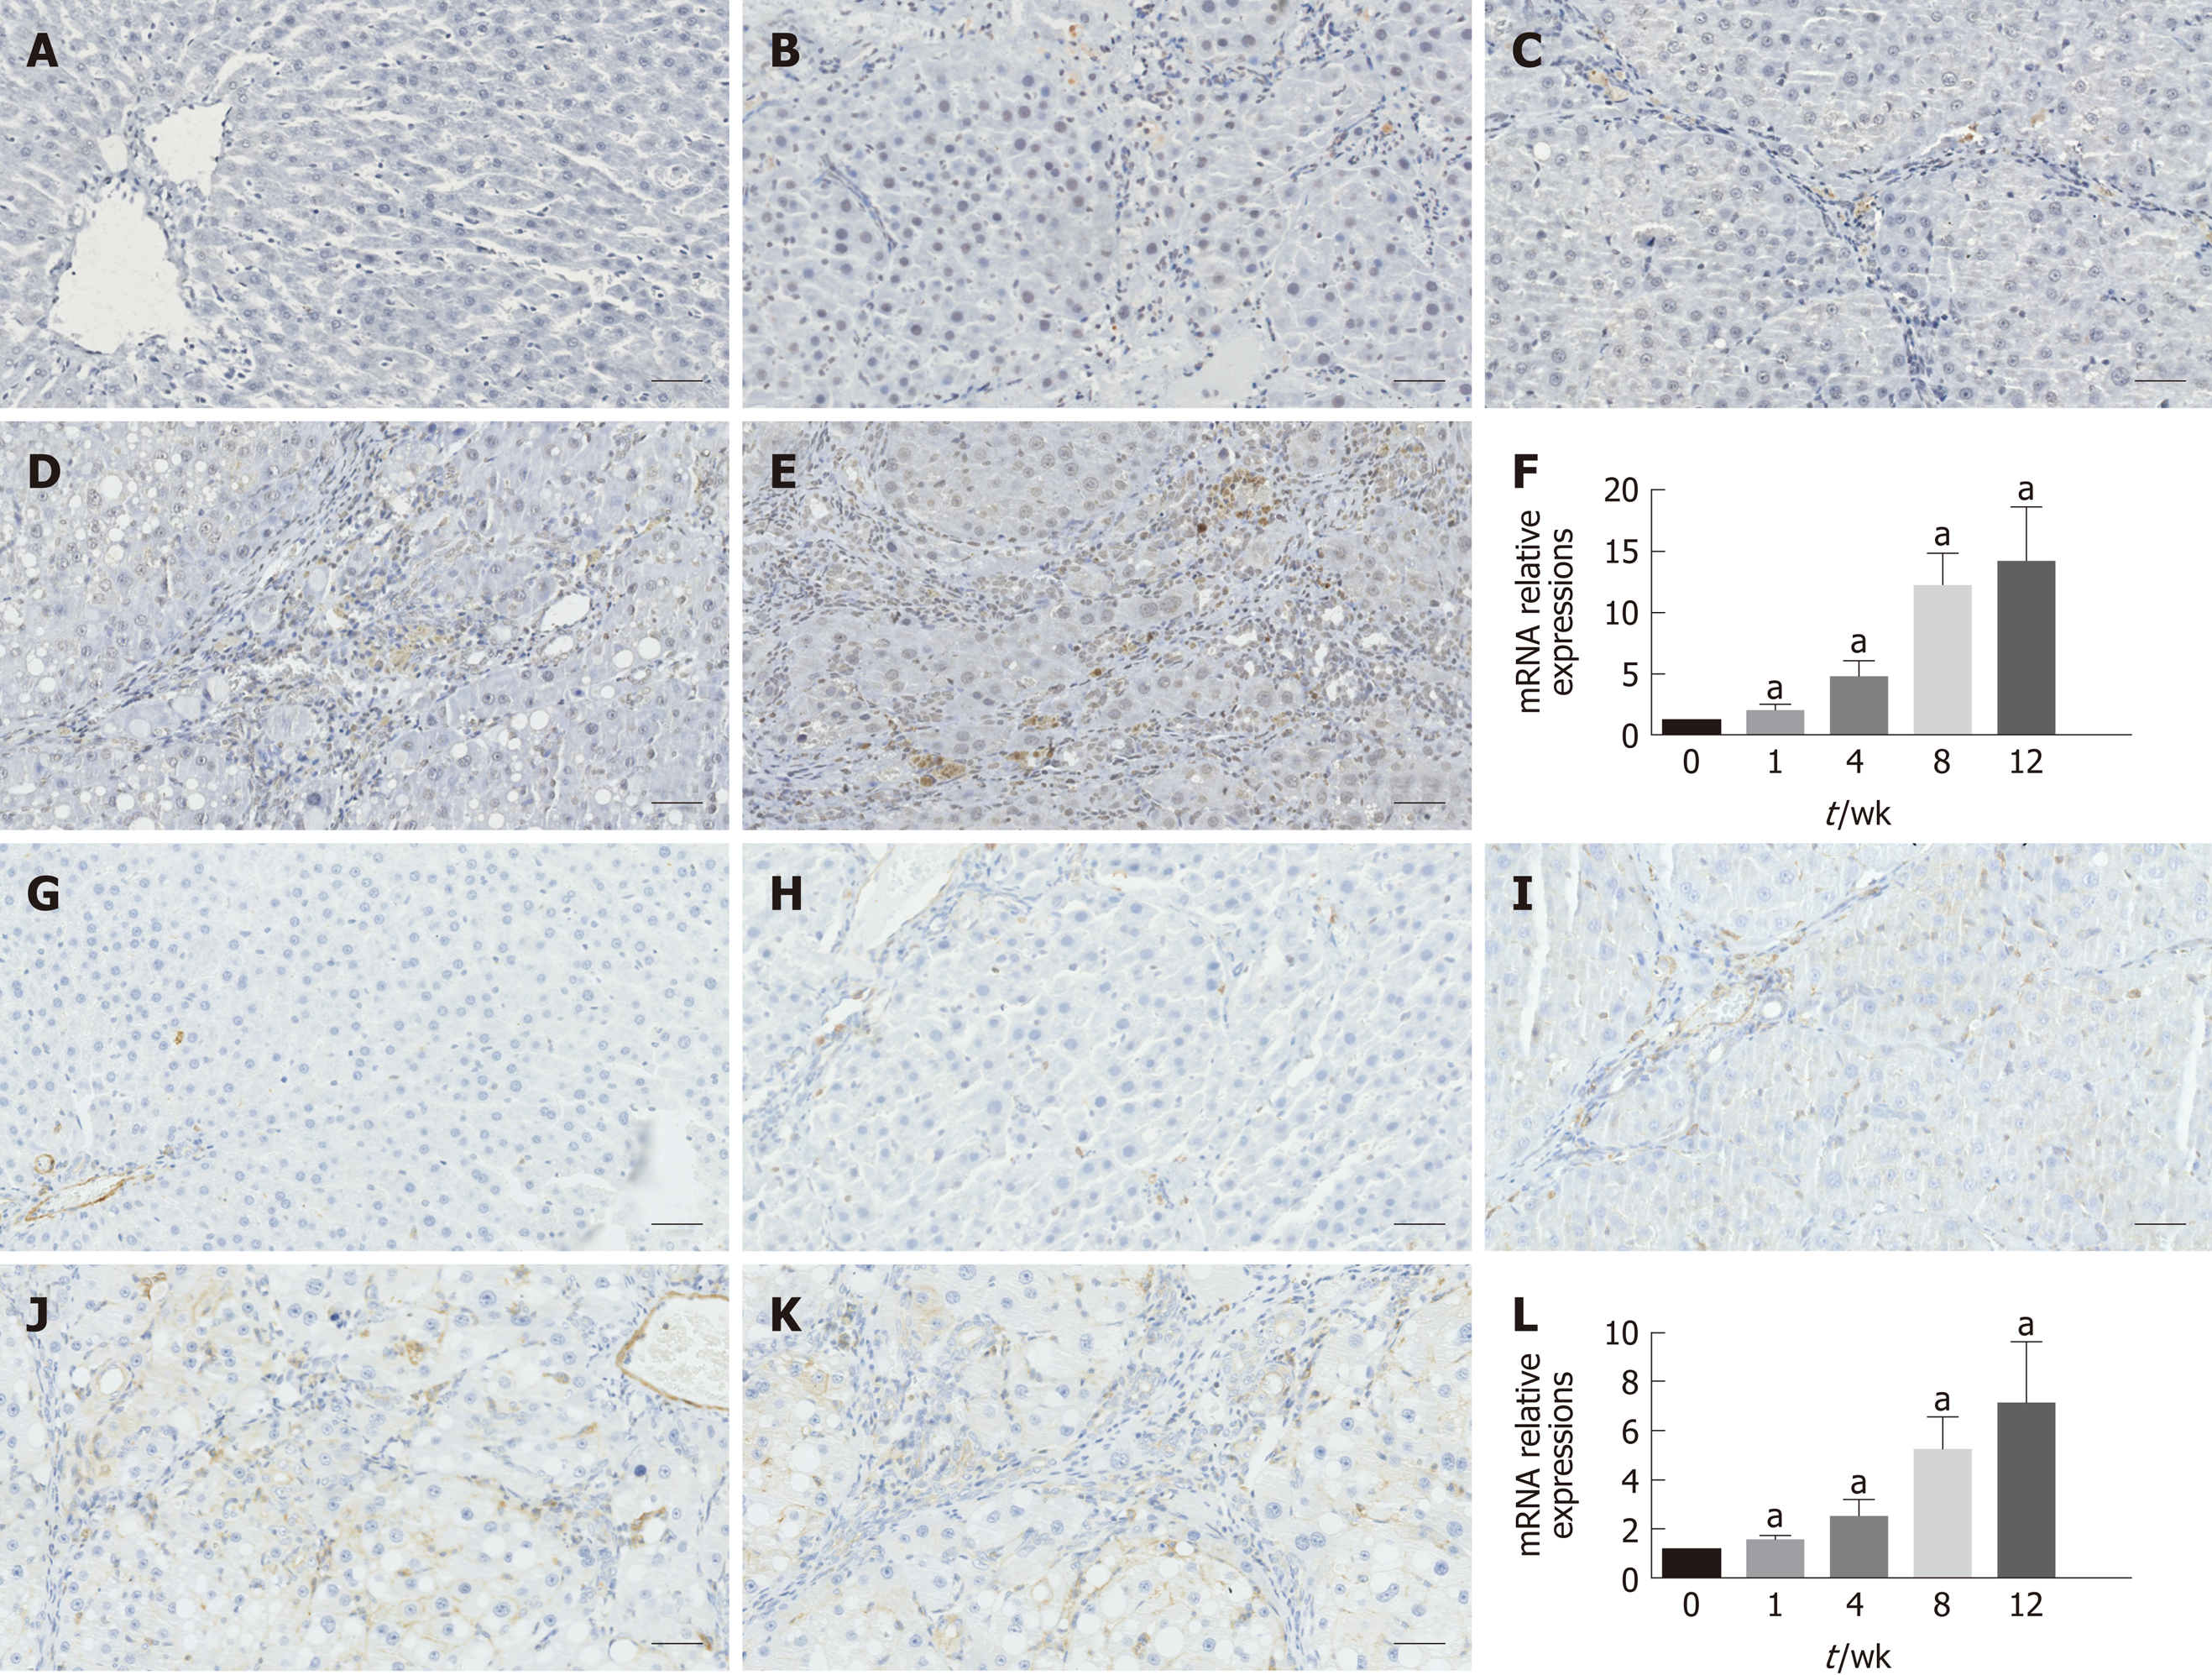
Figure 3 Immunohistochemistry results and relative mRNA expression levels of α-smooth muscle actin and transforming growth factor β1.
A-E: Immunohistochemical staining for α-SMA; F: qRT-PCR results of α-SMA at each time point; G-K: Immunohistochemical staining for TGF-β1; L: qRT-PCR results of TGF-β1 at each time point. The data are presented as the mean ± SD (error bars) and were statistically analyzed using a Student’s t-test. aP < 0.01 vs control. Scale bars: 100 μm. α-SMA: α-smooth muscle actin; TGF-β1: Transforming growth factor-β1; qRT-PCR: Quantitative real-time polymerase chain reaction.
- Citation: Yu J, He JQ, Chen DY, Pan QL, Yang JF, Cao HC, Li LJ. Dynamic changes of key metabolites during liver fibrosis in rats. World J Gastroenterol 2019; 25(8): 941-954
- URL: https://www.wjgnet.com/1007-9327/full/v25/i8/941.htm
- DOI: https://dx.doi.org/10.3748/wjg.v25.i8.941


