Copyright
©The Author(s) 2019.
World J Gastroenterol. Feb 28, 2019; 25(8): 941-954
Published online Feb 28, 2019. doi: 10.3748/wjg.v25.i8.941
Published online Feb 28, 2019. doi: 10.3748/wjg.v25.i8.941
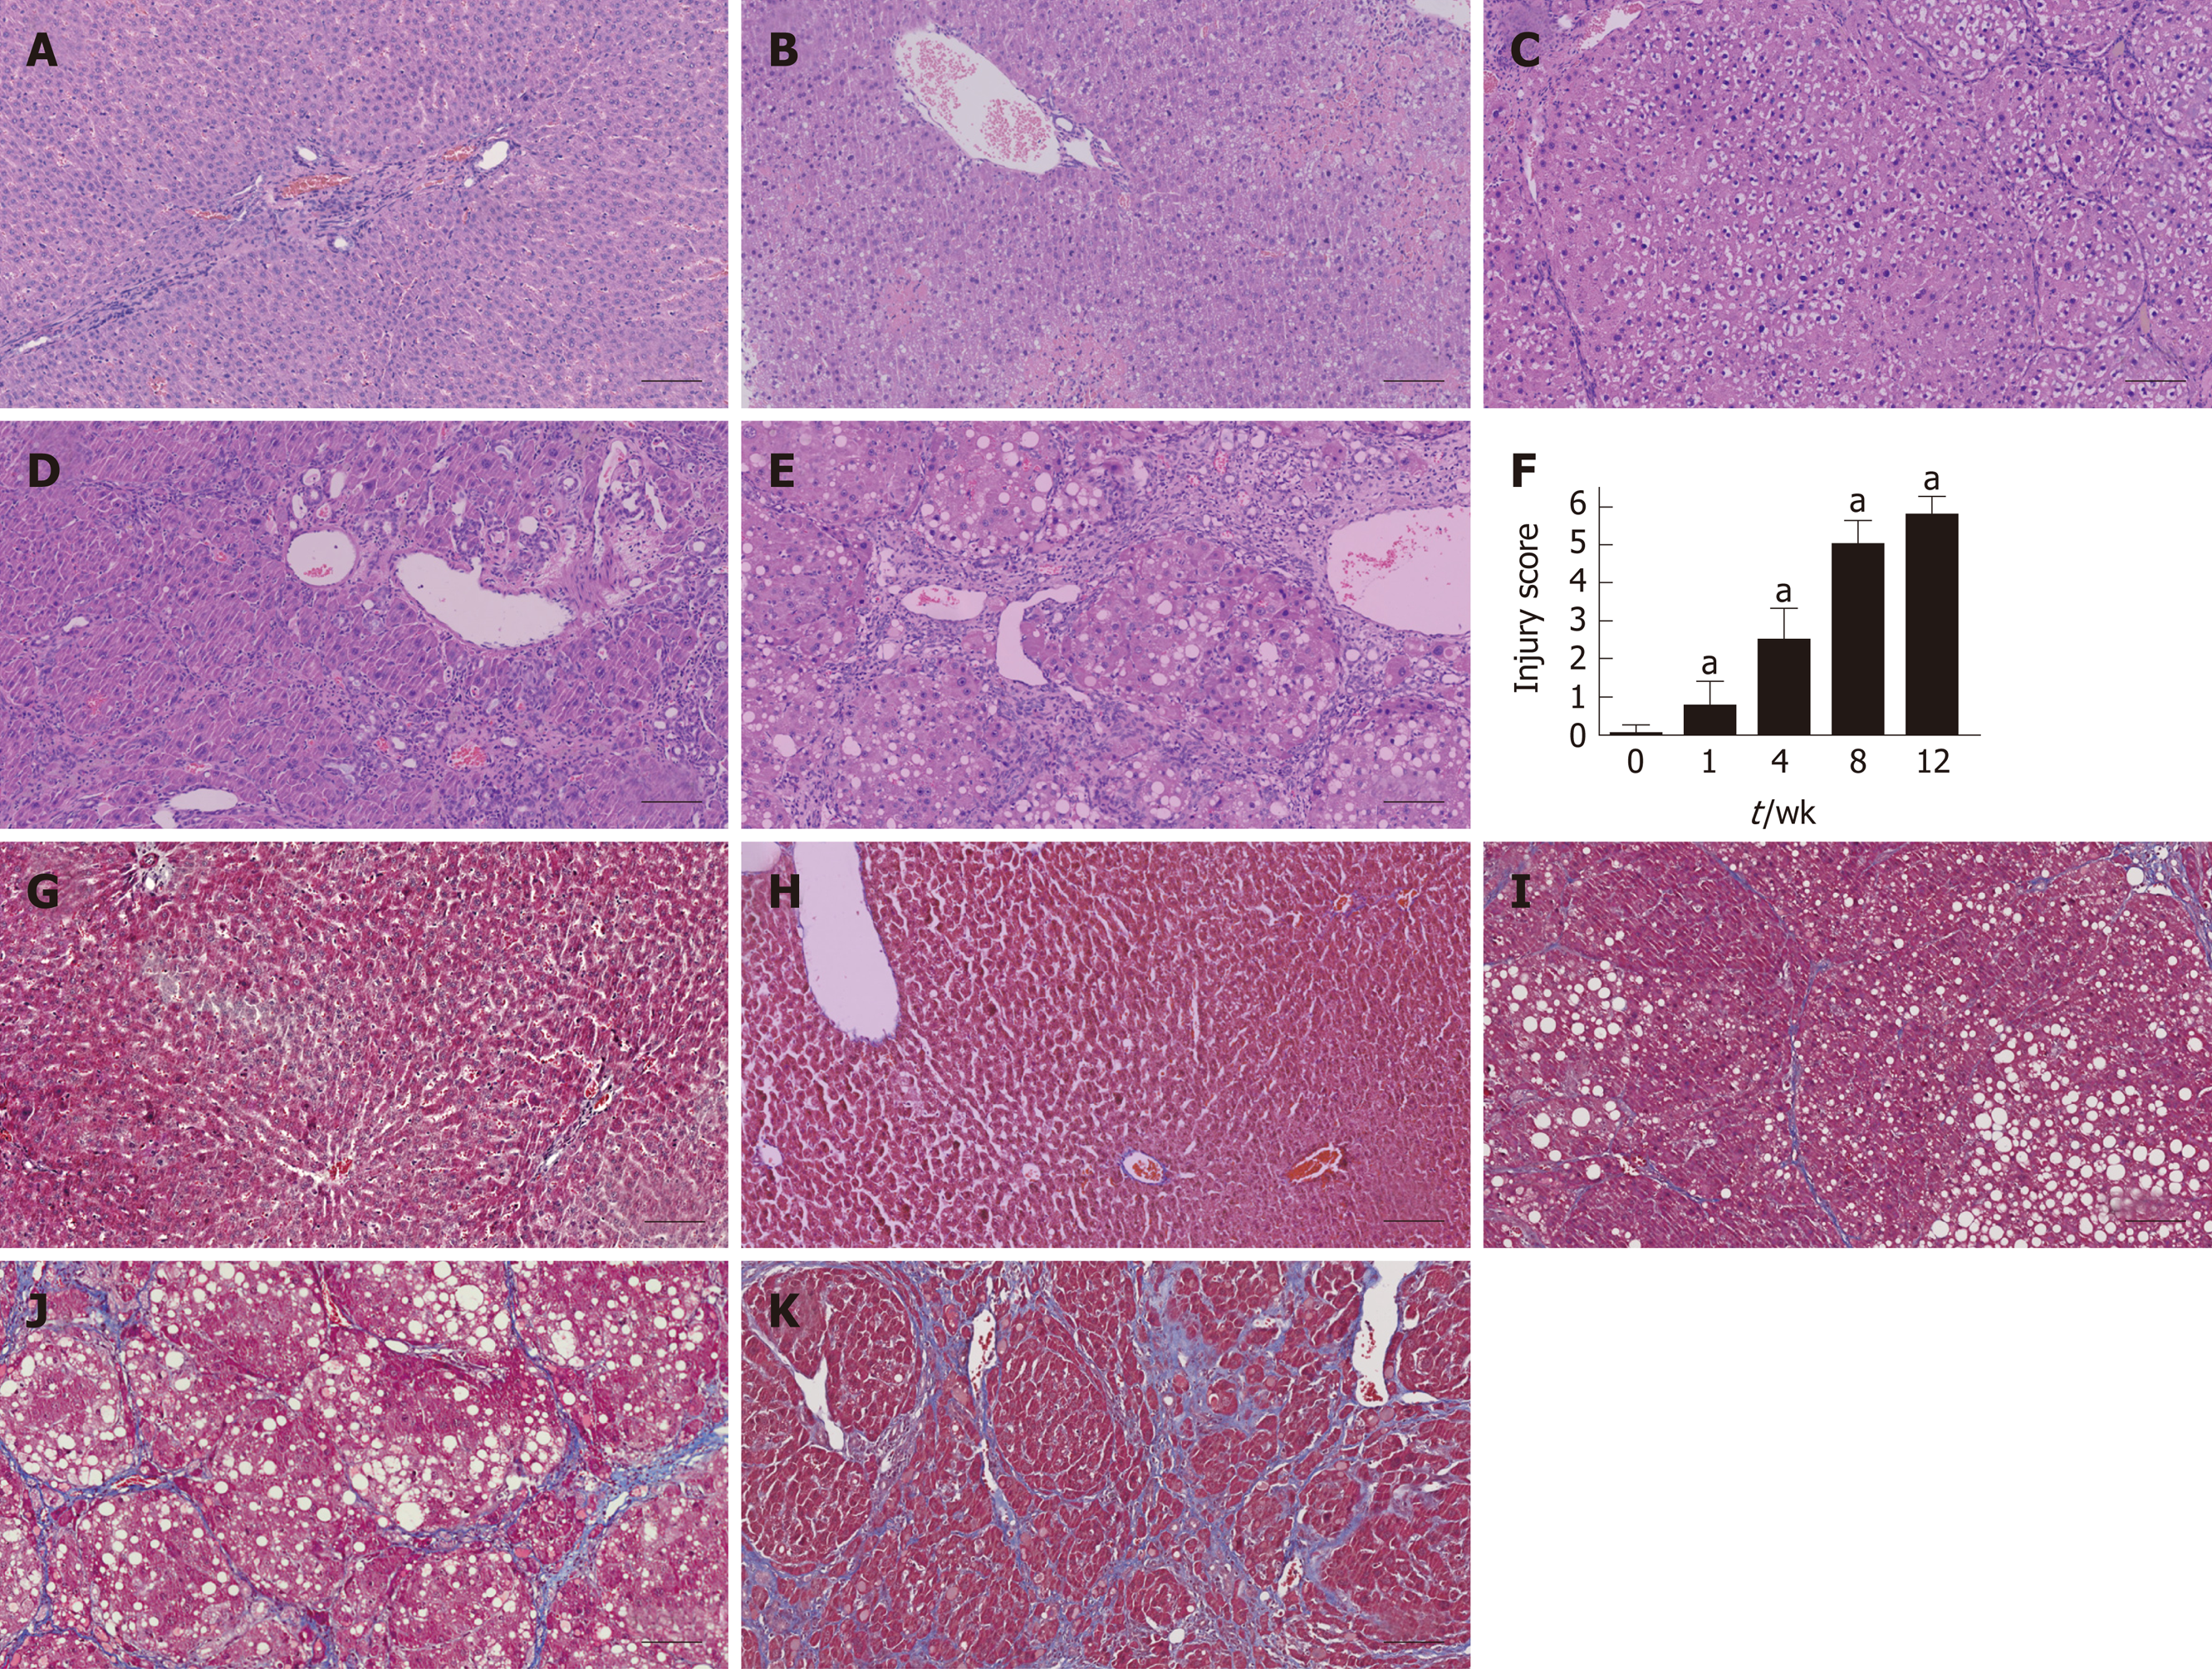
Figure 2 Histological assessment in each group using hematoxylin and eosin and Masson’s trichrome staining.
A-E: Liver tissues were stained with HE in the control and fibrosis model groups at weeks 1, 4, 8, and 12; F: The injury score of fibrosis in each group; G-K: Liver tissues were stained using MTC in the control and fibrosis model groups at weeks 1, 4, 8, and 12 (aP < 0.01 vs control). Scale bars: 100 μm. HE: Hematoxylin and eosin; MTC: Masson’s trichrome.
- Citation: Yu J, He JQ, Chen DY, Pan QL, Yang JF, Cao HC, Li LJ. Dynamic changes of key metabolites during liver fibrosis in rats. World J Gastroenterol 2019; 25(8): 941-954
- URL: https://www.wjgnet.com/1007-9327/full/v25/i8/941.htm
- DOI: https://dx.doi.org/10.3748/wjg.v25.i8.941


