Copyright
©The Author(s) 2019.
World J Gastroenterol. Dec 7, 2019; 25(45): 6634-6652
Published online Dec 7, 2019. doi: 10.3748/wjg.v25.i45.6634
Published online Dec 7, 2019. doi: 10.3748/wjg.v25.i45.6634
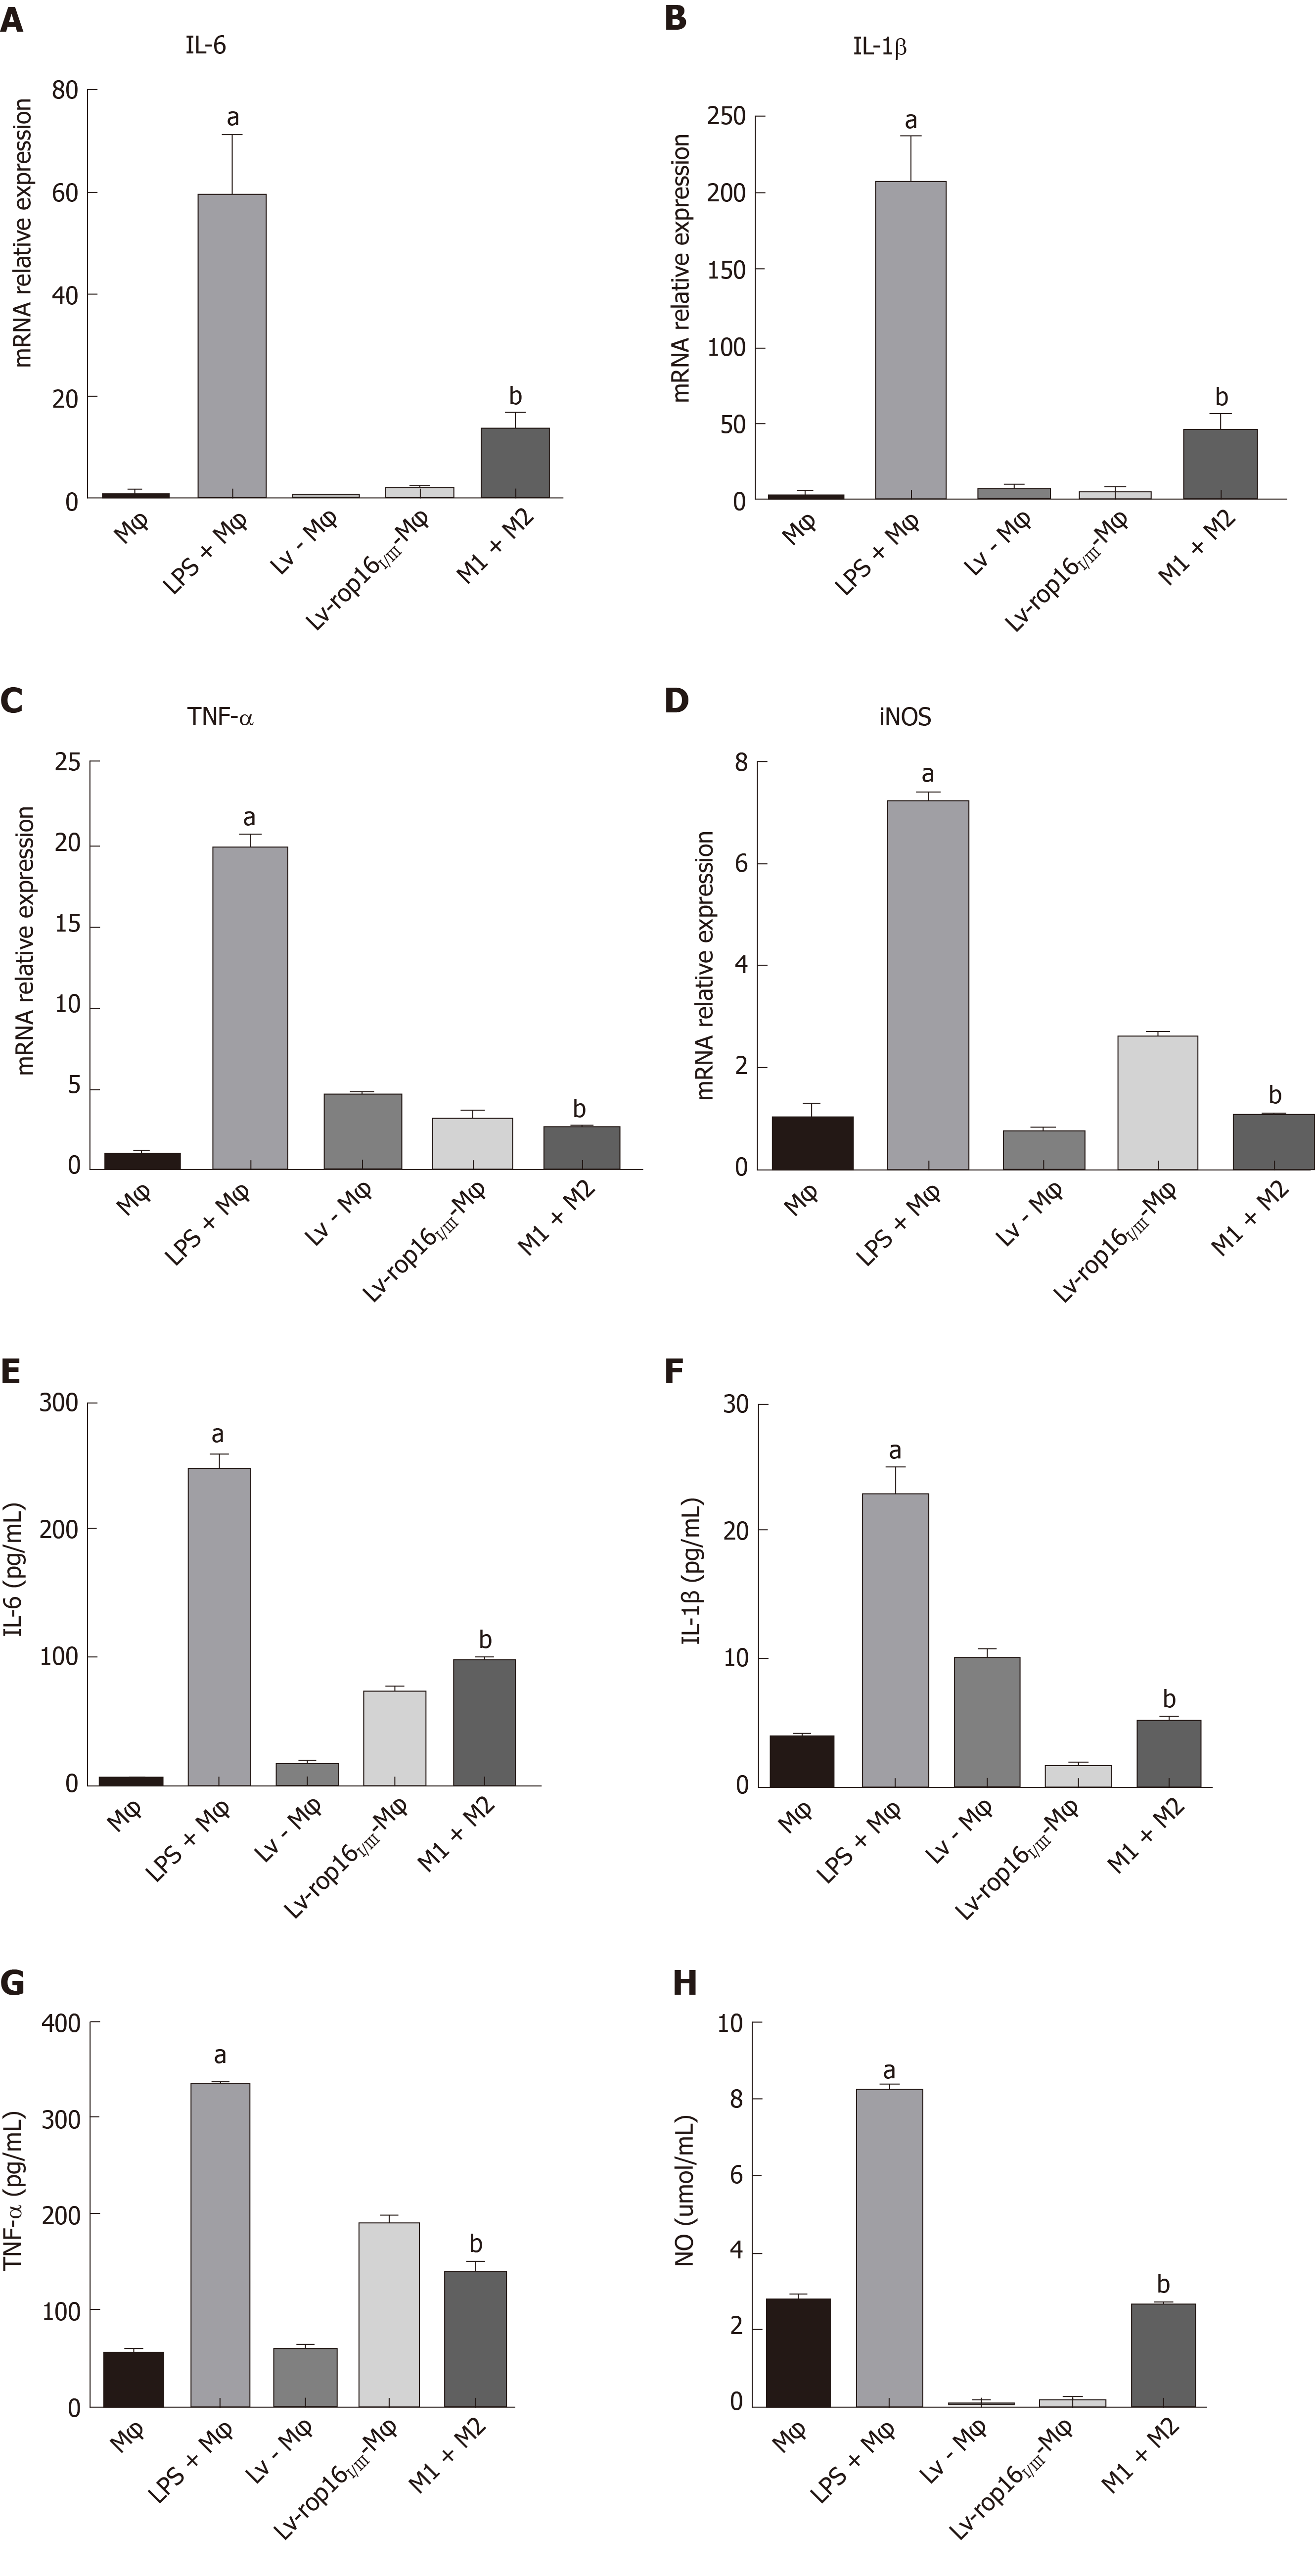
Figure 3 The proinflammatory cytokines produced by M1, and mixed M1 and M2 cells.
A-D: The mRNA expression levels of interleukin (IL)-6, IL-1β, tumour necrosis factor (TNF)-α, and iNOS were significantly increased in M1 cells by quantitative real-time reverse transcriptase polymerase chain reaction. Levels were normalized to those of β-actin. E-G: E-G: Expression of IL-6, IL-1β, and TNF-α was remarkably increased in the M1 cells in comparison with the control when examined by ELISA. D: The relative mRNA expression of iNOS was also increased in the M1 cell group. H: The nitric oxide (NO) was upregulated relative to normal macrophages as measured by the Griess method. The production of proinflammatory cytokines was markedly decreased in mixed M1 and M2 cells compared with M1 cells. The NO was measured by the Griess method. aP < 0.001 vs Mφ; bP < 0.001 vs lipopolysaccharide + Mφ. iNOS: Inducible nitric oxide synthase; NO: Nitric oxide; IL: Interleukin; LPS: Lipopolysaccharide; LV- Mφ: Lentivirus transfer into macrophages; LV-rop16I/III- Mφ: Lentivirus-rop16I/III transfer into macrophages.
- Citation: Xu YW, Xing RX, Zhang WH, Li L, Wu Y, Hu J, Wang C, Luo QL, Shen JL, Chen X. Toxoplasma ROP16I/III ameliorated inflammatory bowel diseases via inducing M2 phenotype of macrophages. World J Gastroenterol 2019; 25(45): 6634-6652
- URL: https://www.wjgnet.com/1007-9327/full/v25/i45/6634.htm
- DOI: https://dx.doi.org/10.3748/wjg.v25.i45.6634


