Copyright
©The Author(s) 2019.
World J Gastroenterol. Nov 28, 2019; 25(44): 6508-6526
Published online Nov 28, 2019. doi: 10.3748/wjg.v25.i44.6508
Published online Nov 28, 2019. doi: 10.3748/wjg.v25.i44.6508
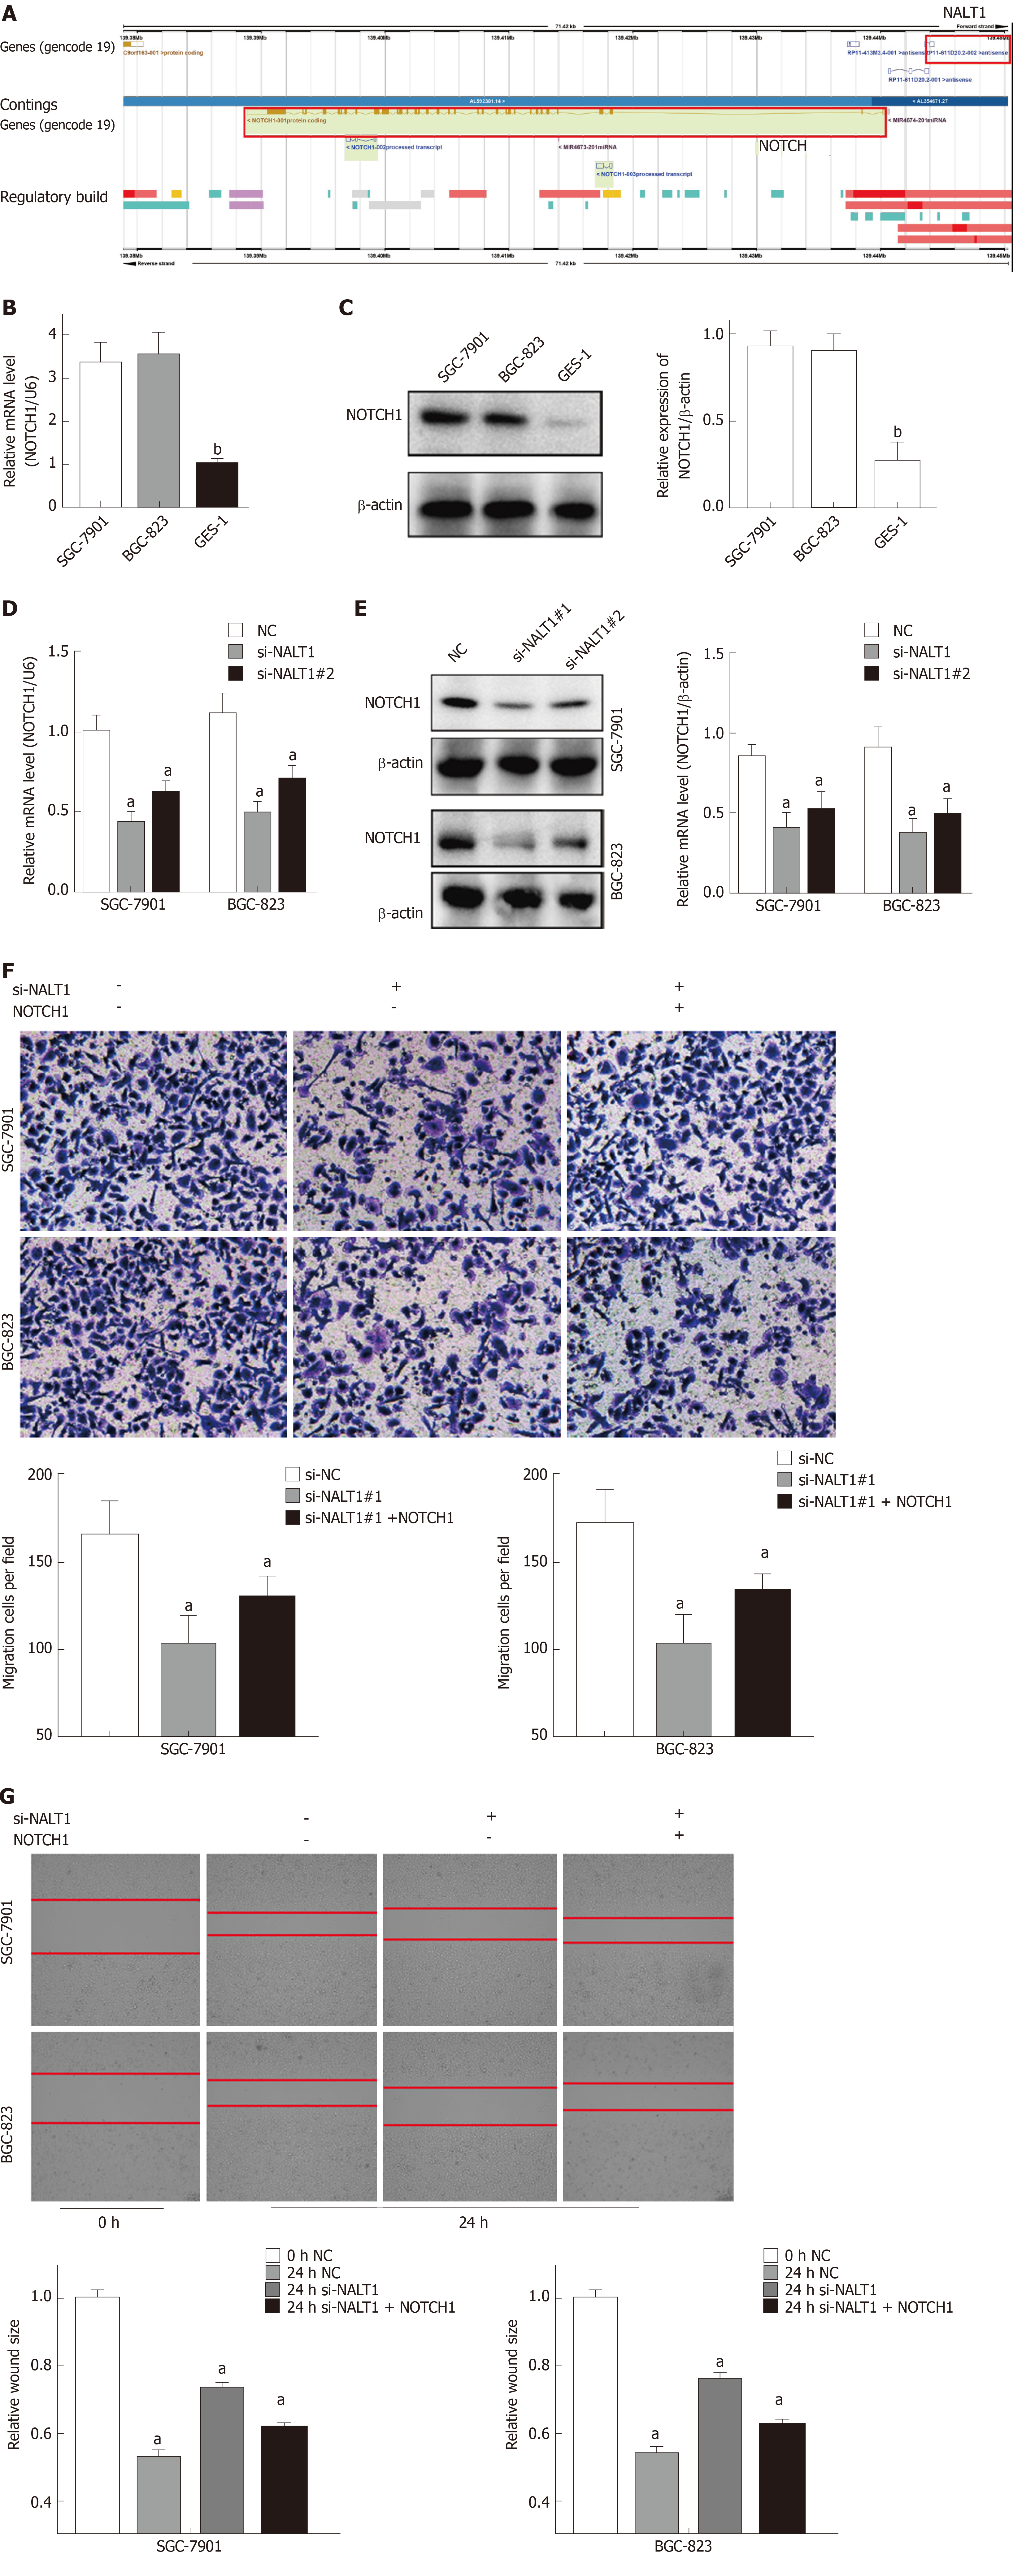
Figure 5 NALT1 influence NOTCH1 expression.
A: Schematic figure of NALT1 and NOTCH1 in chromosome 9. They were highlight with red box; B: NOTCH1 was overexpression in GC cells by RT-PCR; C: NOTCH1 was overexpression in GC cells by western-blot; D: The expression of NOTCH1 mRNA was effected by NALT1; E: The expression of protein was effected by NALT1; F: Transwell assay was used to evaluate the association of NALT1 and NOTCH1 in invasion in NALT1-knockdown and NALT1-knockdown + NOTCH1-overexpression GC cells; G: Scrape motility assays were monitored for 24 h in NALT1-knockdown and NALT1-knockdown + NOTCH1-overexpression GC cells. U6 and β-actin were used as loading control in RT-PCR and western-blot, respectively. In all figures, 100 × magnification was used. n = 3, aP < 0.05, bP < 0.01. NALT1: NOTCH1 associated with lncRNA in T cell acute lymphoblastic leukemia 1; GC: Gastric cancer.
- Citation: Piao HY, Guo S, Wang Y, Zhang J. Long noncoding RNA NALT1-induced gastric cancer invasion and metastasis via NOTCH signaling pathway. World J Gastroenterol 2019; 25(44): 6508-6526
- URL: https://www.wjgnet.com/1007-9327/full/v25/i44/6508.htm
- DOI: https://dx.doi.org/10.3748/wjg.v25.i44.6508


