Copyright
©The Author(s) 2019.
World J Gastroenterol. Nov 21, 2019; 25(43): 6451-6464
Published online Nov 21, 2019. doi: 10.3748/wjg.v25.i43.6451
Published online Nov 21, 2019. doi: 10.3748/wjg.v25.i43.6451
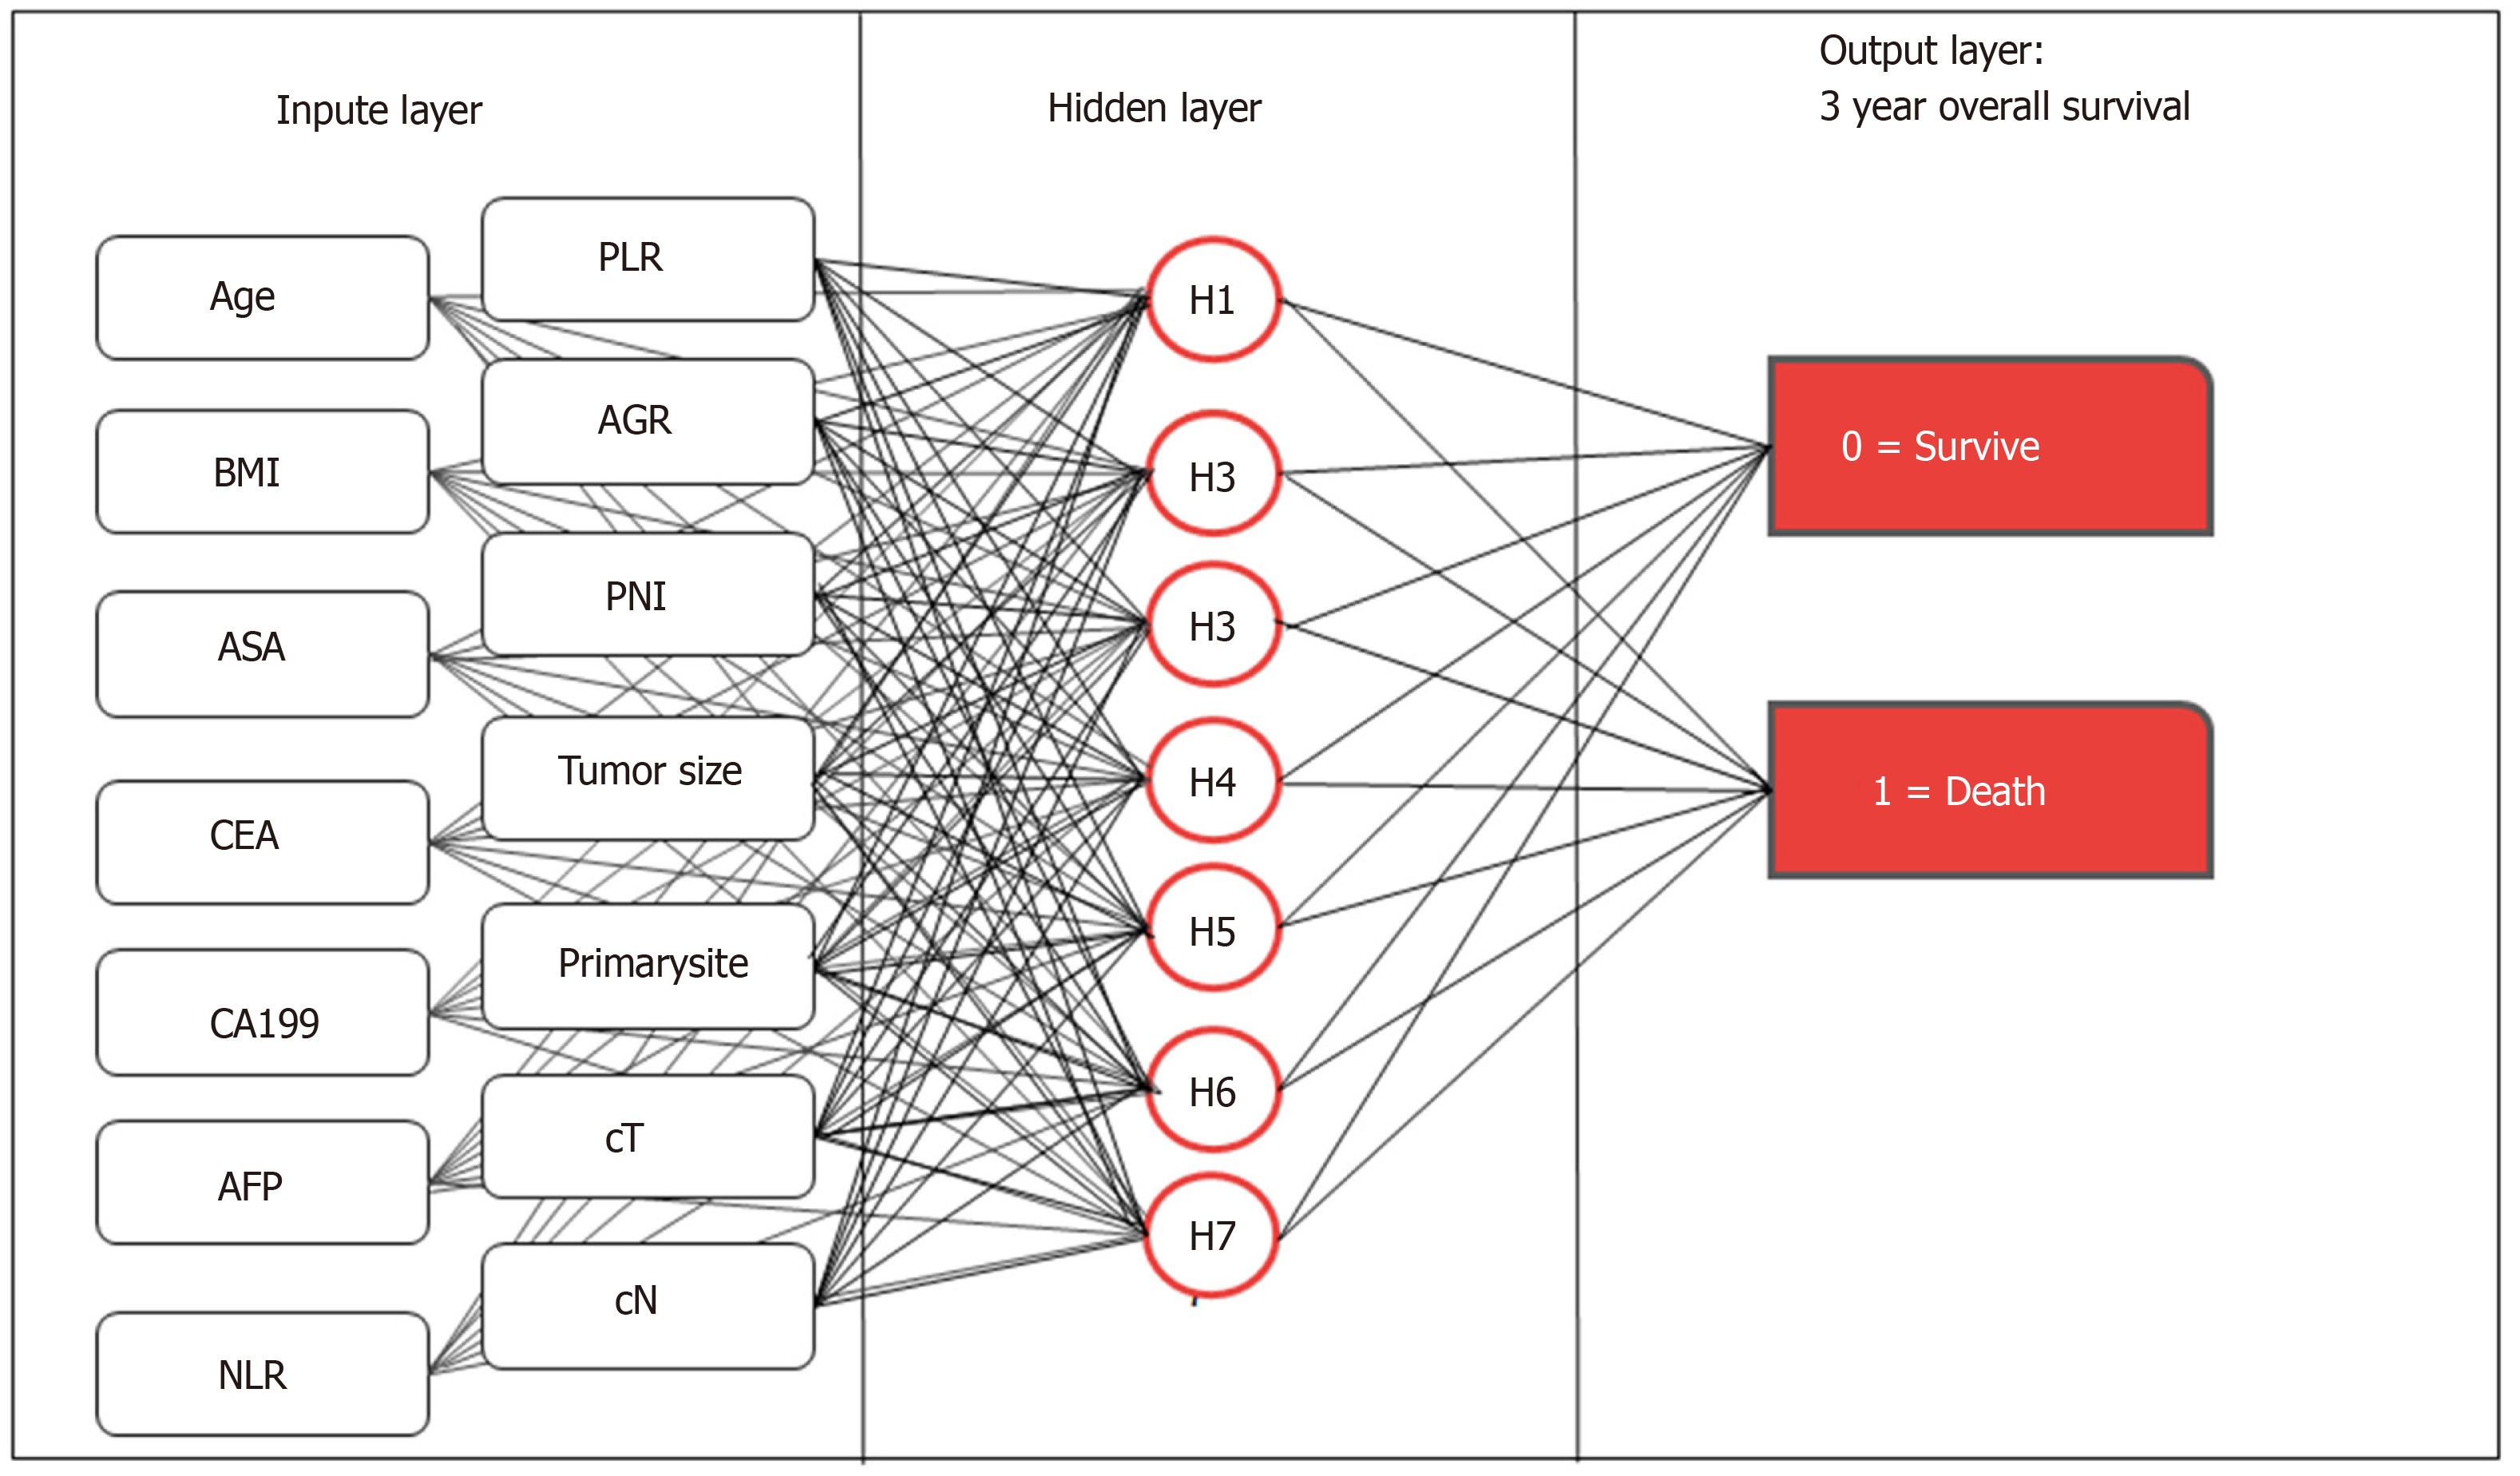
Figure 1 Structure diagram of the preoperative artificial neural network model.
Age, sex, body mass index, American society of anesthesiologists score, tumor location, tumor size, prognostic nutrition index, albumin-globulin ratio, neutrophil-lymphocyte ratio, platelet-lymphocyte ratio, clinical T stage, clinical N stage, carcinoembryonic antigen, carbohydrate antigen 19-9, and alpha fetoprotein are the input variables. All weighted values passed to the hidden layer node are summed on the hidden layer node and passed to the output node through the sigmoid function. All weighted values entering the output node are summed again and passed through the sigmoid function. For each patient, the probability of output is 0-1.0. In the training of the artificial neural network, the output values are compared with the real results of each patient. The weight is adjusted so that the next time the patient appears on the network, the network output is closer to the real result. NLR: Neutrophil-lymphocyte ratio; PLR: Platelet-lymphocyte ratio; AGR: Albumin-globulin ratio; PNI: Prognostic nutrition index; BMI: Body mass index; ASA: American society of anesthesiologists score; cT: Clinical T stage; cN: Clinical N stage; CEA: Carcinoembryonic antigen; CA199: Carbohydrate antigen 19-9; AFP: Alpha fetoprotein.
- Citation: Que SJ, Chen QY, Qing-Zhong, Liu ZY, Wang JB, Lin JX, Lu J, Cao LL, Lin M, Tu RH, Huang ZN, Lin JL, Zheng HL, Li P, Zheng CH, Huang CM, Xie JW. Application of preoperative artificial neural network based on blood biomarkers and clinicopathological parameters for predicting long-term survival of patients with gastric cancer. World J Gastroenterol 2019; 25(43): 6451-6464
- URL: https://www.wjgnet.com/1007-9327/full/v25/i43/6451.htm
- DOI: https://dx.doi.org/10.3748/wjg.v25.i43.6451


