Copyright
©The Author(s) 2019.
World J Gastroenterol. Nov 21, 2019; 25(43): 6404-6415
Published online Nov 21, 2019. doi: 10.3748/wjg.v25.i43.6404
Published online Nov 21, 2019. doi: 10.3748/wjg.v25.i43.6404
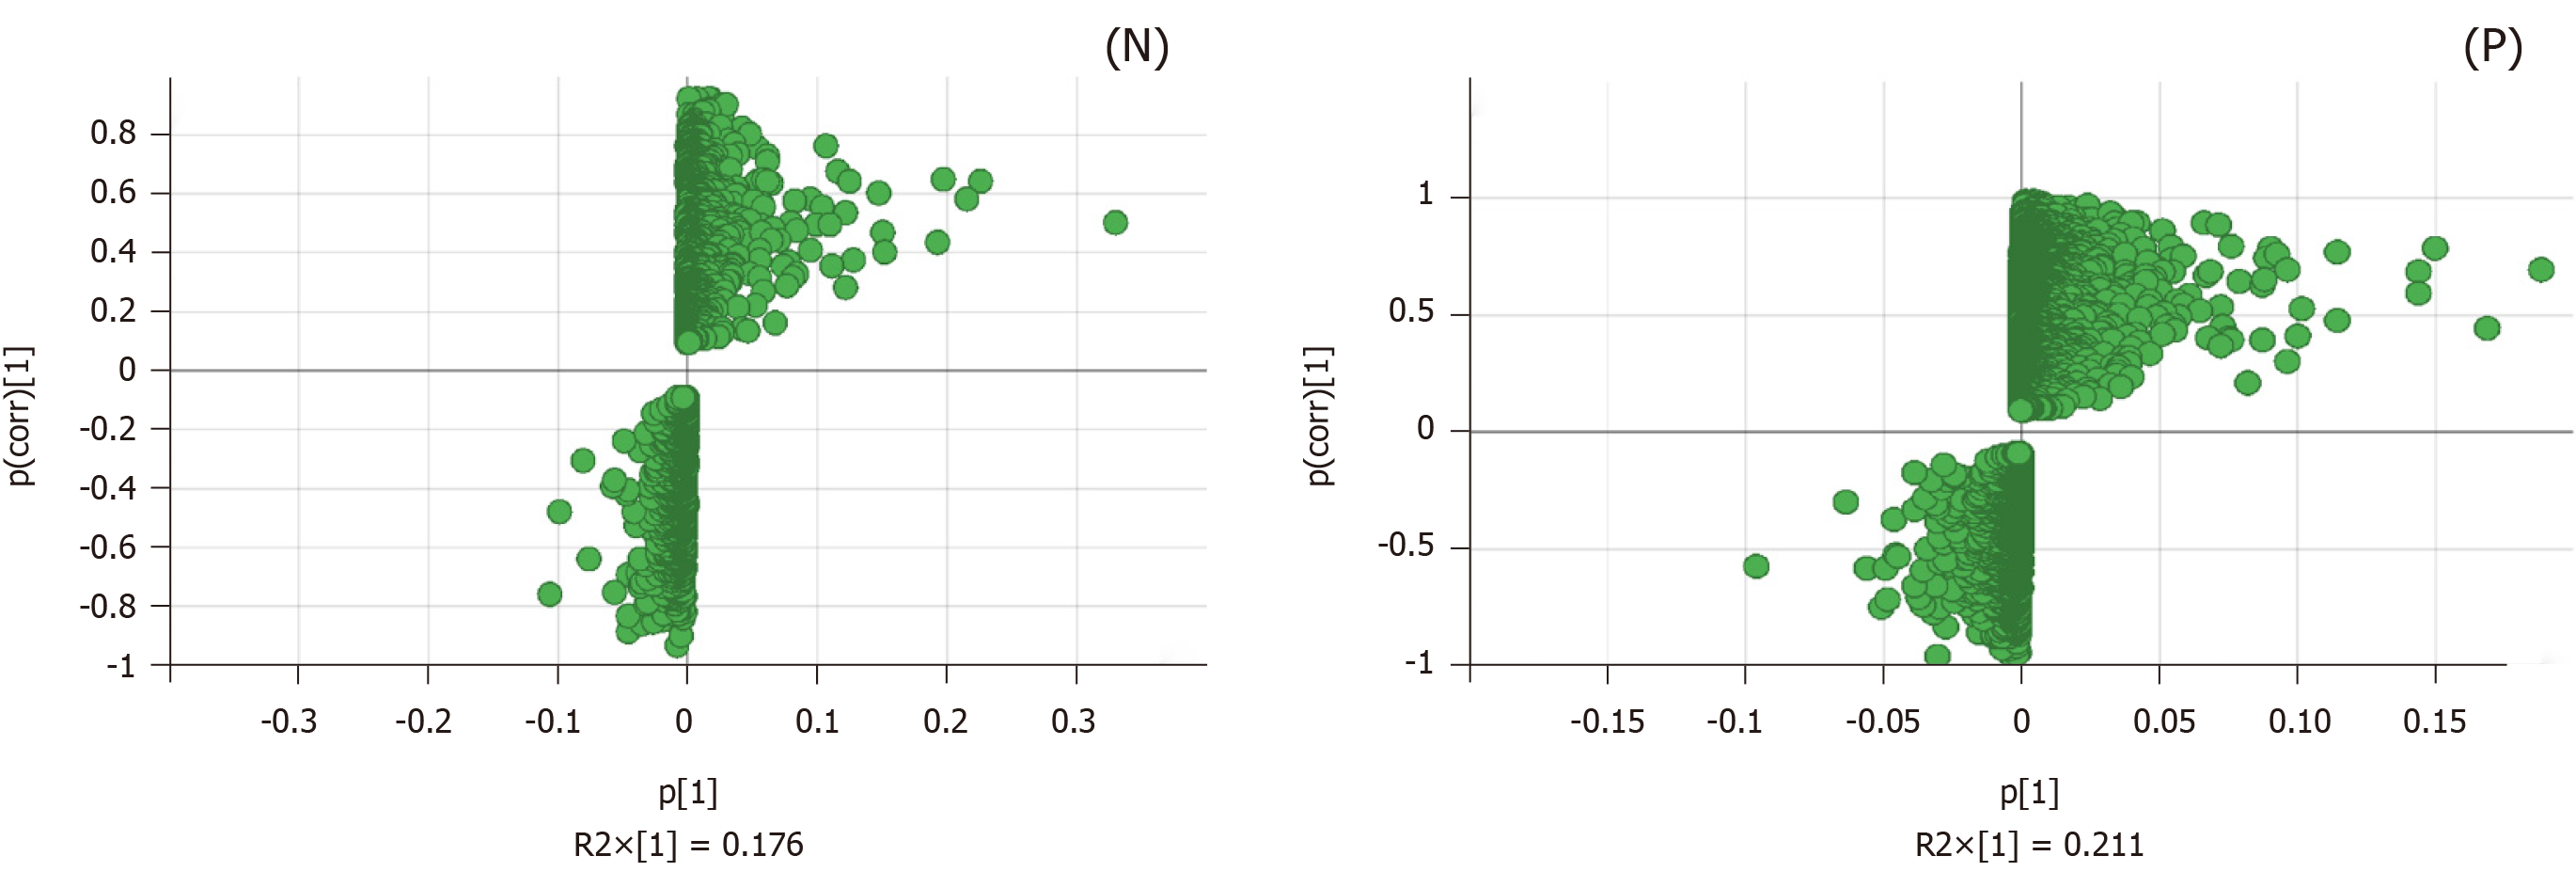
Figure 5 S-plot loading diagram of the model and Polygonatum kingianum groups’ mitochondrial samples in the negative and positive ion mode.
Each point represents a variable that shows the biomarker that caused the difference between the model and Polygonatum kingianum groups. N: Negative; P: Positive.
- Citation: Yang XX, Wei JD, Mu JK, Liu X, Li FJ, Li YQ, Gu W, Li JP, Yu J. Mitochondrial metabolomic profiling for elucidating the alleviating potential of Polygonatum kingianum against high-fat diet-induced nonalcoholic fatty liver disease. World J Gastroenterol 2019; 25(43): 6404-6415
- URL: https://www.wjgnet.com/1007-9327/full/v25/i43/6404.htm
- DOI: https://dx.doi.org/10.3748/wjg.v25.i43.6404


