Copyright
©The Author(s) 2019.
World J Gastroenterol. Nov 7, 2019; 25(41): 6258-6272
Published online Nov 7, 2019. doi: 10.3748/wjg.v25.i41.6258
Published online Nov 7, 2019. doi: 10.3748/wjg.v25.i41.6258
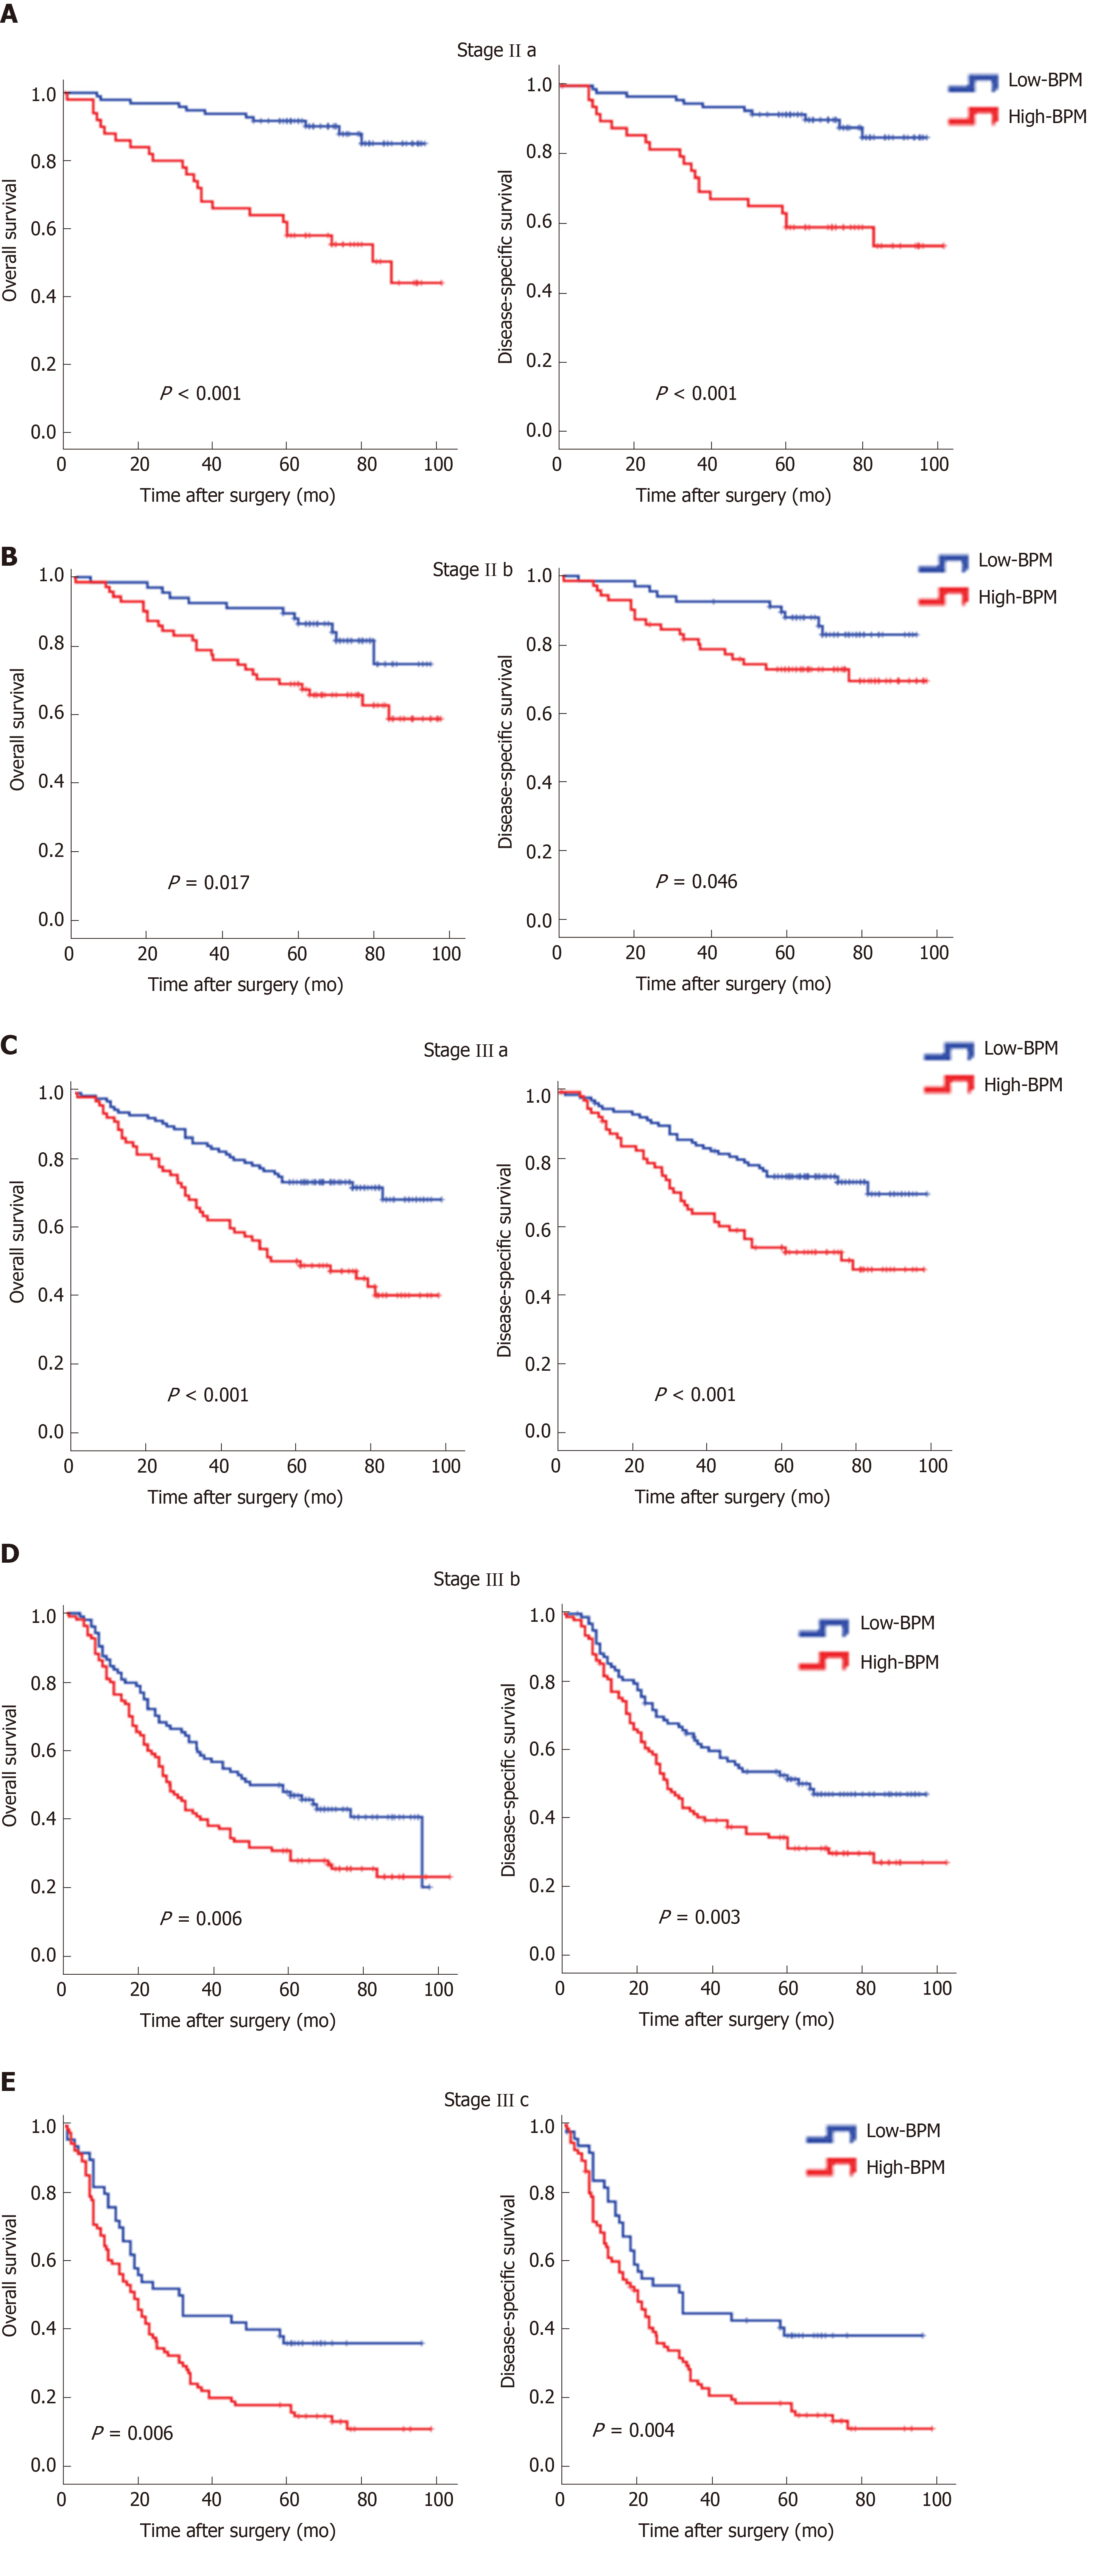
Figure 3 Kaplan-Meier curves for overall survival and disease-specific survival in the high-blood parameters or low-blood parameters groups for different stages.
A: Stage IIa; B: Stage IIb; C: Stage IIIa; D: Stage IIIb; E: Stage IIIc. BPM: Blood parameters.
- Citation: Lin JX, Tang YH, Wang JB, Lu J, Chen QY, Cao LL, Lin M, Tu RH, Huang CM, Li P, Zheng CH, Xie JW. Blood parameters score predicts long-term outcomes in stage II-III gastric cancer patients. World J Gastroenterol 2019; 25(41): 6258-6272
- URL: https://www.wjgnet.com/1007-9327/full/v25/i41/6258.htm
- DOI: https://dx.doi.org/10.3748/wjg.v25.i41.6258


