Copyright
©The Author(s) 2019.
World J Gastroenterol. Jan 28, 2019; 25(4): 498-508
Published online Jan 28, 2019. doi: 10.3748/wjg.v25.i4.498
Published online Jan 28, 2019. doi: 10.3748/wjg.v25.i4.498
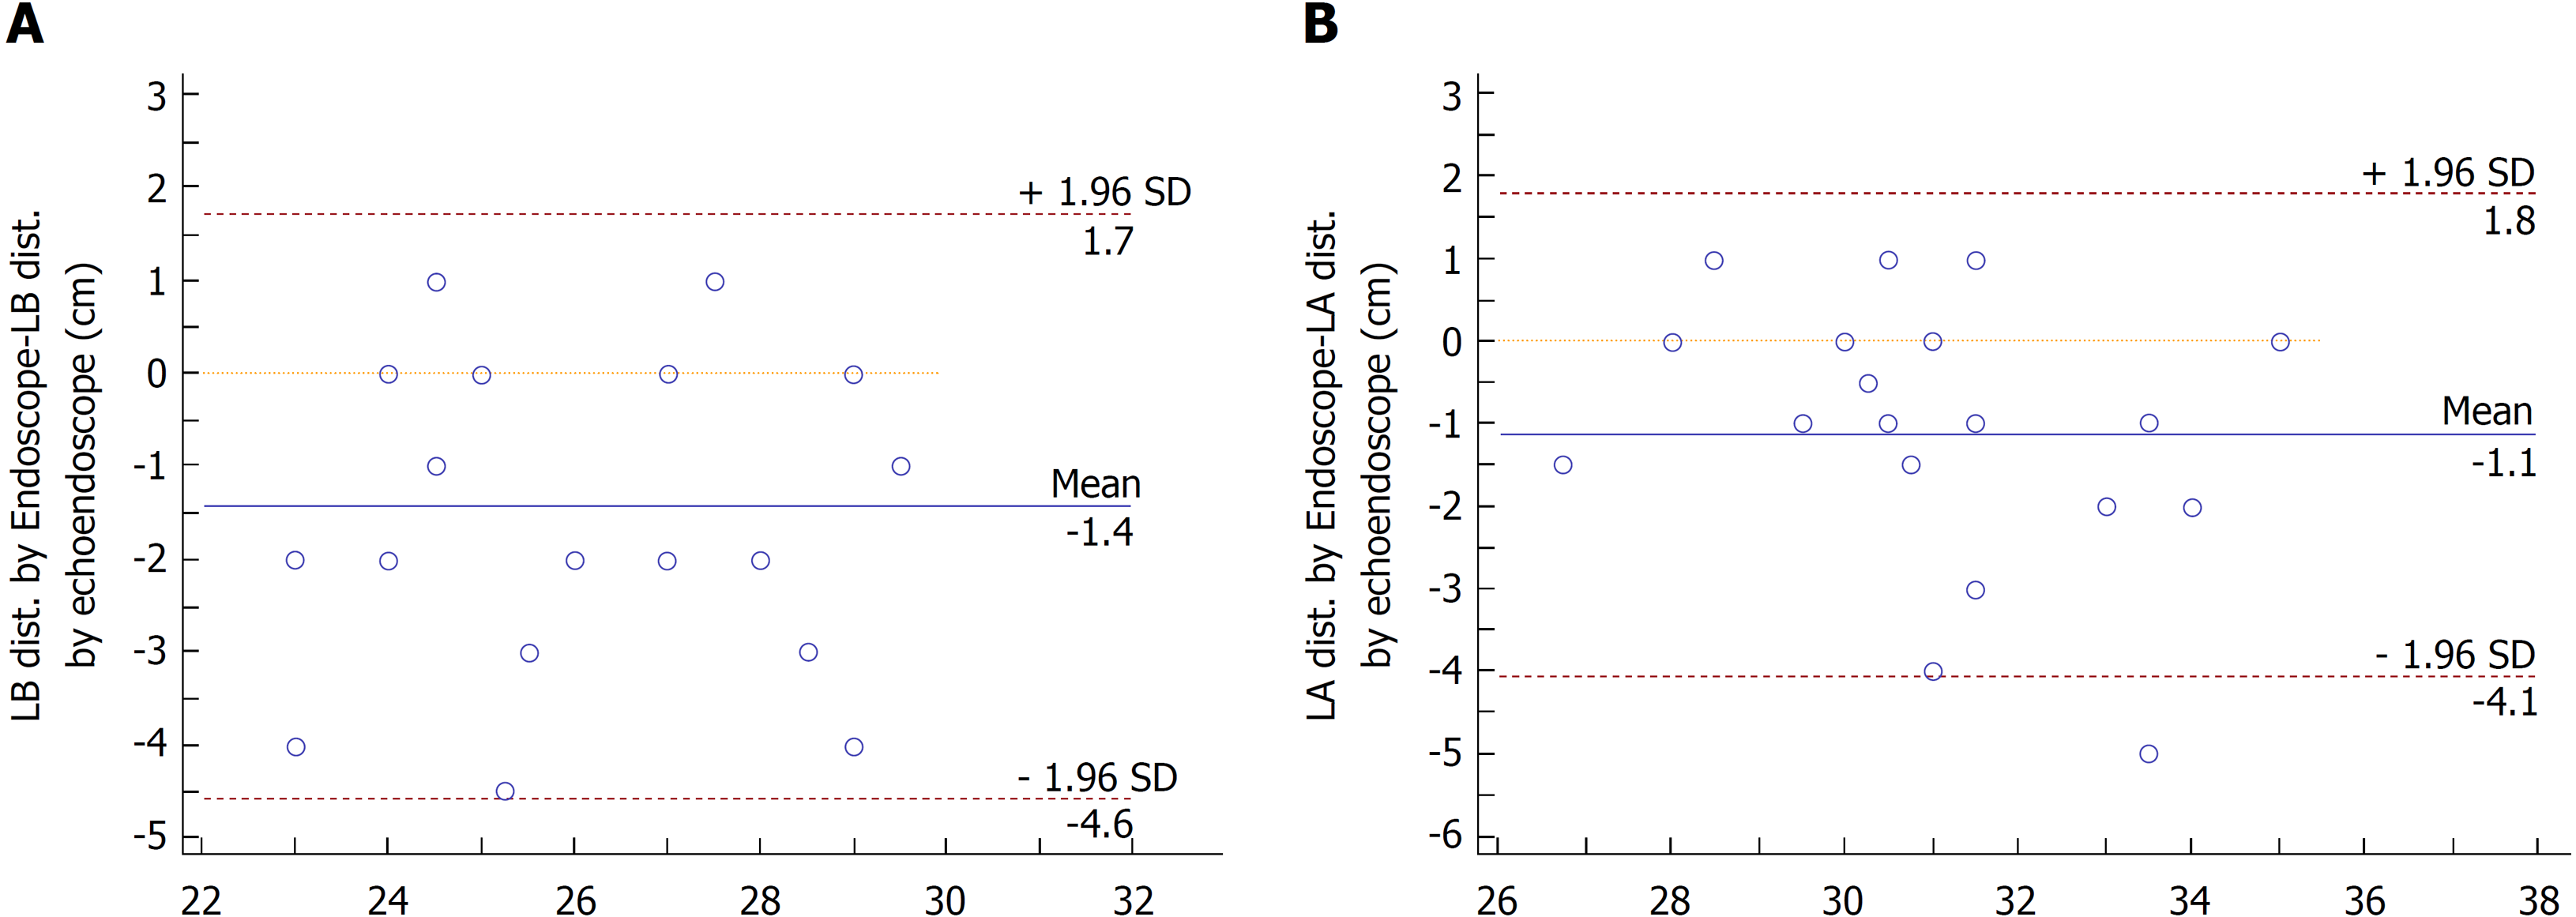
Figure 5 The Bland-Altman plot.
High agreement (IC 95%) is observed between white light and EUS measurements in the sub-study. A: Left main bronchus. B: Left atrium.
- Citation: Emura F, Gomez-Esquivel R, Rodriguez-Reyes C, Benias P, Preciado J, Wallace M, Giraldo-Cadavid L. Endoscopic identification of endoluminal esophageal landmarks for radial and longitudinal orientation and lesion location. World J Gastroenterol 2019; 25(4): 498-508
- URL: https://www.wjgnet.com/1007-9327/full/v25/i4/498.htm
- DOI: https://dx.doi.org/10.3748/wjg.v25.i4.498


