Copyright
©The Author(s) 2019.
World J Gastroenterol. Jan 28, 2019; 25(4): 433-446
Published online Jan 28, 2019. doi: 10.3748/wjg.v25.i4.433
Published online Jan 28, 2019. doi: 10.3748/wjg.v25.i4.433
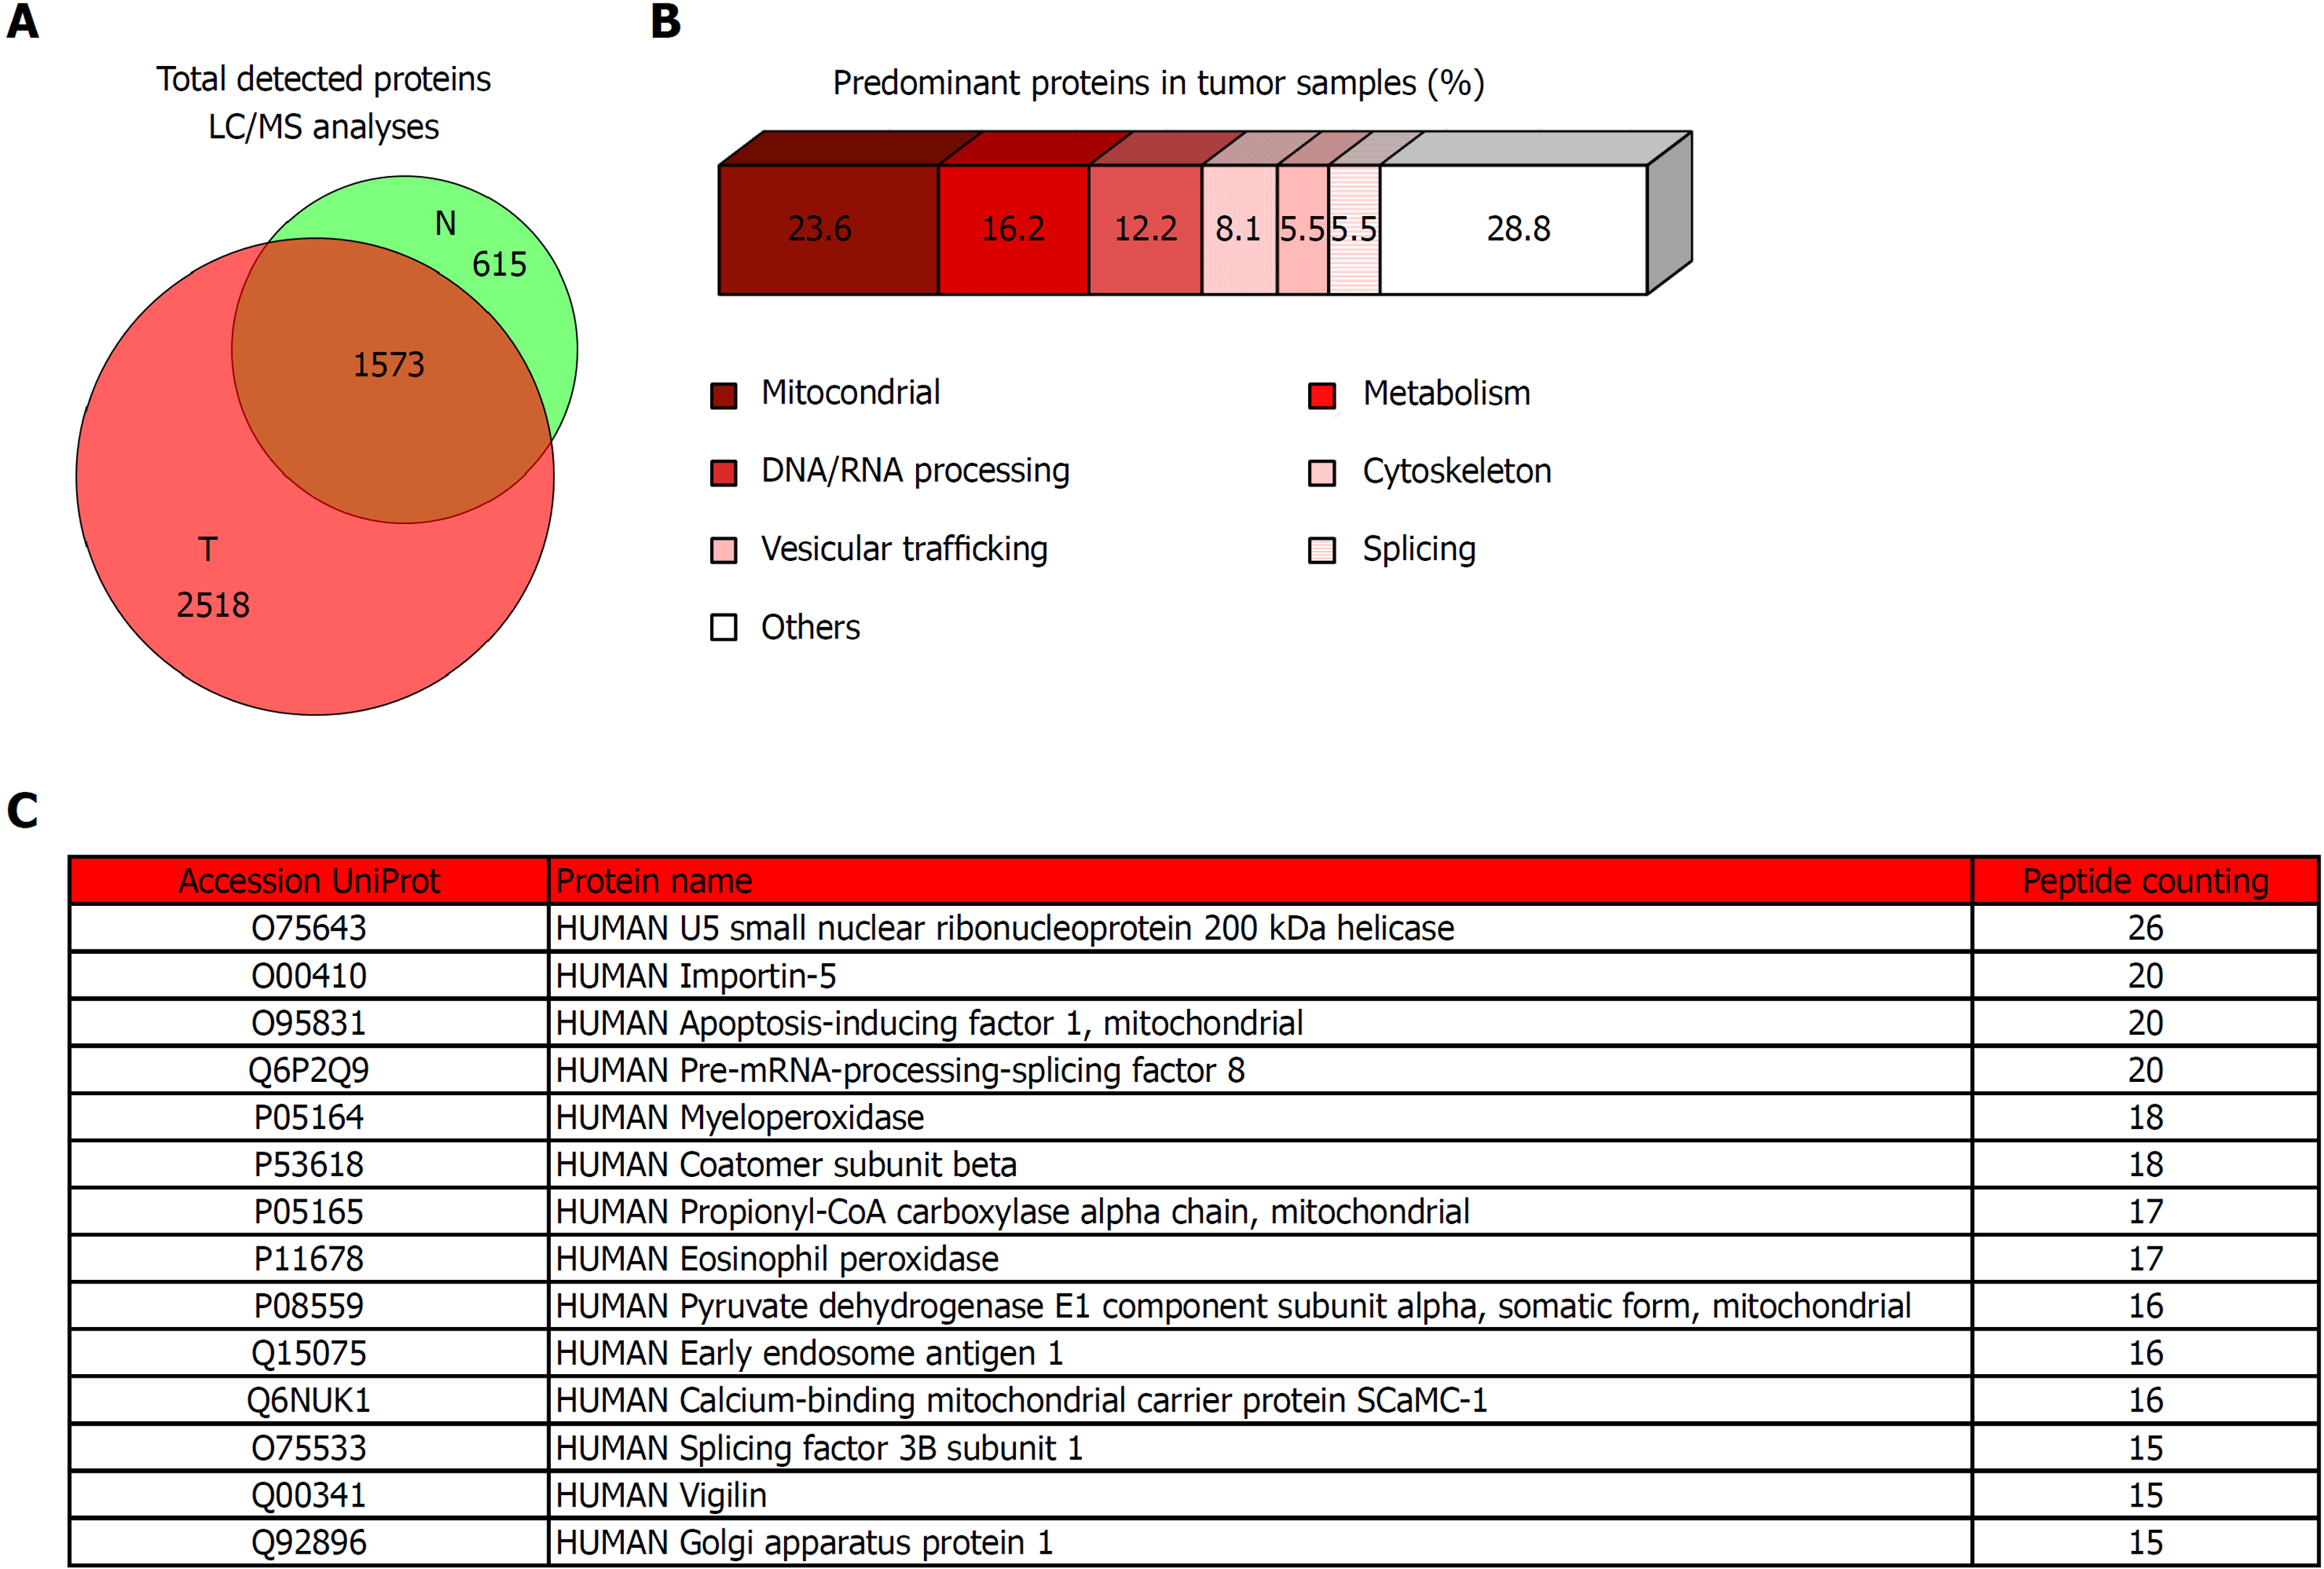
Figure 5 Proteomic analysis of tumor tissue of colorectal cancer patients and the corresponding non-tumor adjacent tissue.
A: Venn diagram with specific and overlapped proteins. 2188 and 4091 proteins were identified (FDR < 1%) in non-tumor and tumor tissue, respectively. Among them, 1573 were identified in both tissues, and 615 and 2518 were unique in non-tumor and tumor tissue, respectively. B: Enrichment analysis of specific proteins identified in tumor tissue by mass spectrometry performed with proteins that were identified with 5 or more peptides (271 most abundant proteins). Most of these proteins had mitochondrial and metabolic function, or were involved in processes related to nucleic acids processing, cytoskeleton, vesicular trafficking, or splicing. C: Specific tumor tissue proteins identified with 15 or more peptides in liquid chromatography-mass spectrometry analyses. T: Tumor; N: Non-tumor; LC/MS: Liquid chromatography-mass spectrometry.
- Citation: Prieto P, Jaén RI, Calle D, Gómez-Serrano M, Núñez E, Fernández-Velasco M, Martín-Sanz P, Alonso S, Vázquez J, Cerdán S, Peinado MÁ, Boscá L. Interplay between post-translational cyclooxygenase-2 modifications and the metabolic and proteomic profile in a colorectal cancer cohort. World J Gastroenterol 2019; 25(4): 433-446
- URL: https://www.wjgnet.com/1007-9327/full/v25/i4/433.htm
- DOI: https://dx.doi.org/10.3748/wjg.v25.i4.433


