Copyright
©The Author(s) 2019.
World J Gastroenterol. Oct 21, 2019; 25(39): 5973-5990
Published online Oct 21, 2019. doi: 10.3748/wjg.v25.i39.5973
Published online Oct 21, 2019. doi: 10.3748/wjg.v25.i39.5973
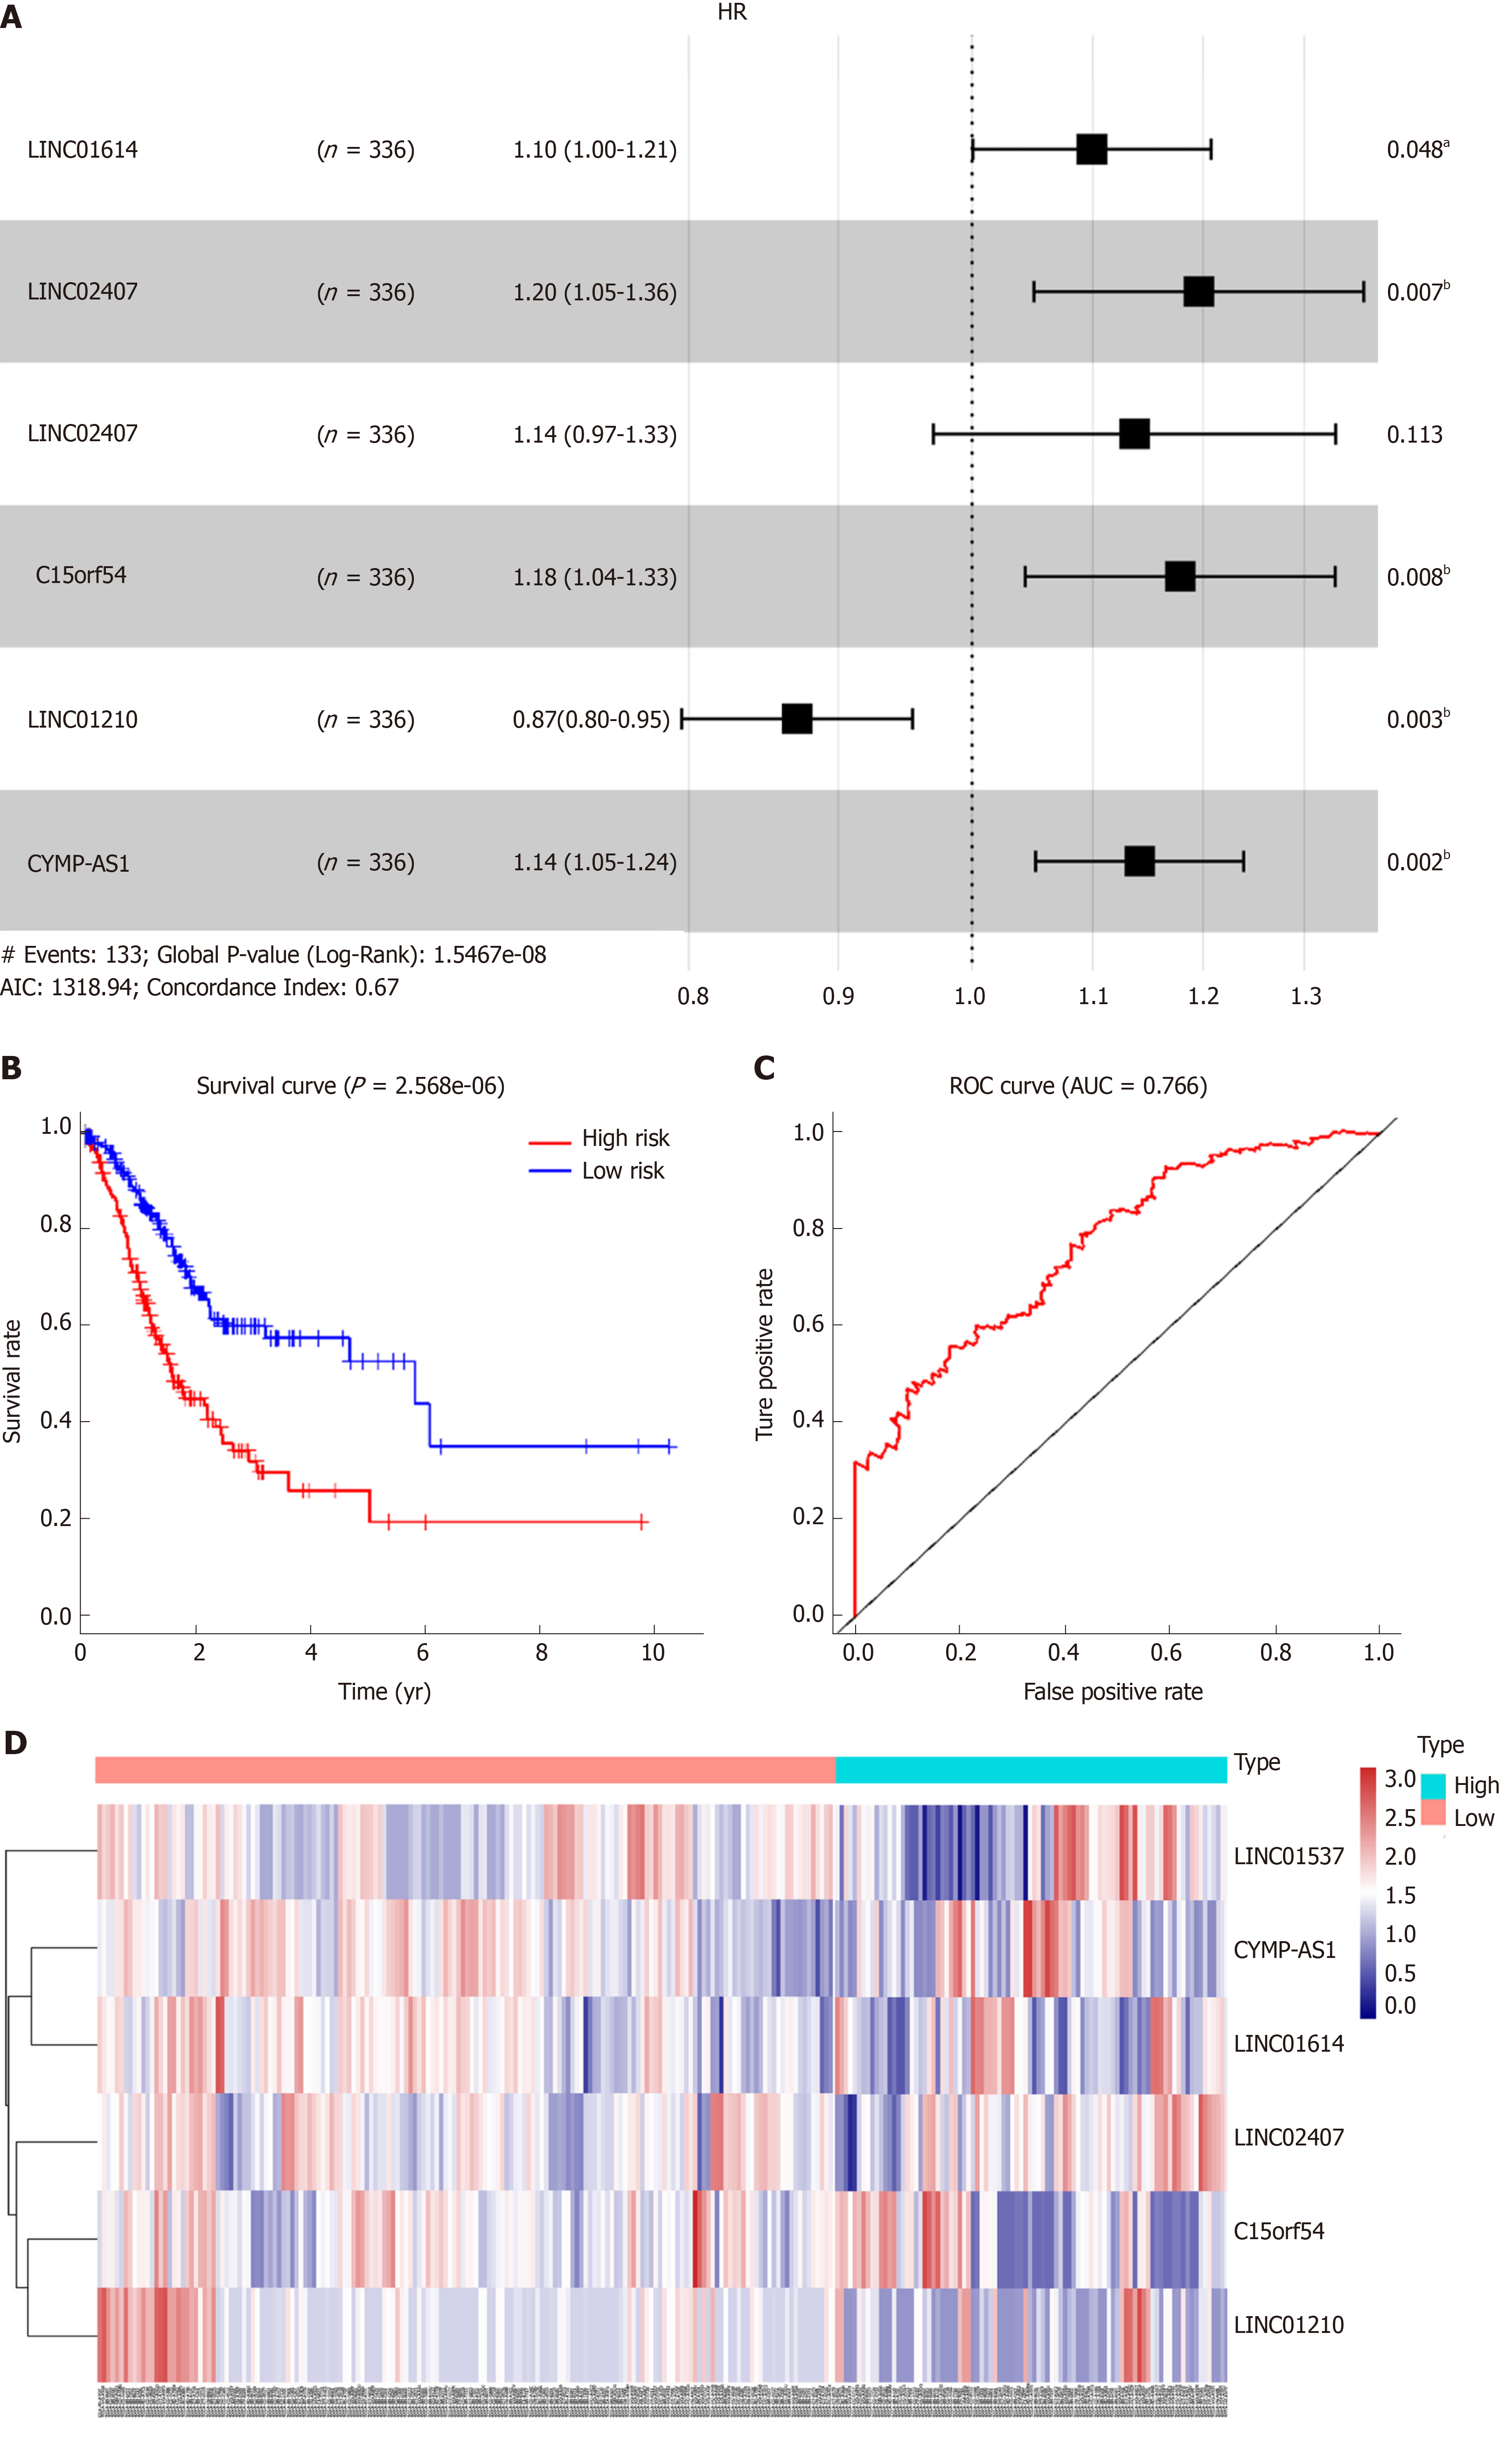
Figure 3 Association between long noncoding RNA expression and survival.
A: Forest plot showing the hazard ratio (HR) and P value for overall survival (OS) in patients with gastric cancer (GC) based on long noncoding RNA (lncRNA) high vs low expression; B: Kaplan-Meier analysis of OS according lncRNA expression levels; C: Receiver operating characteristic curve analysis based on a forest plot showing the hazard ratio and OS; D: HR heatmap representing associations between LIN01614, LIN01537, LIN02407, C15orf54, and CYMP-AS1 expression and OS in patients with different clinicopathological characteristics. Only HRs with P values less than 0.05 are shown. HR: Hazard ratio; ROC: Receiver operating characteristic; AUC: Area under curve.
- Citation: Zhou LL, Jiao Y, Chen HM, Kang LH, Yang Q, Li J, Guan M, Zhu G, Liu FQ, Wang S, Bai X, Song YQ. Differentially expressed long noncoding RNAs and regulatory mechanism of LINC02407 in human gastric adenocarcinoma. World J Gastroenterol 2019; 25(39): 5973-5990
- URL: https://www.wjgnet.com/1007-9327/full/v25/i39/5973.htm
- DOI: https://dx.doi.org/10.3748/wjg.v25.i39.5973


